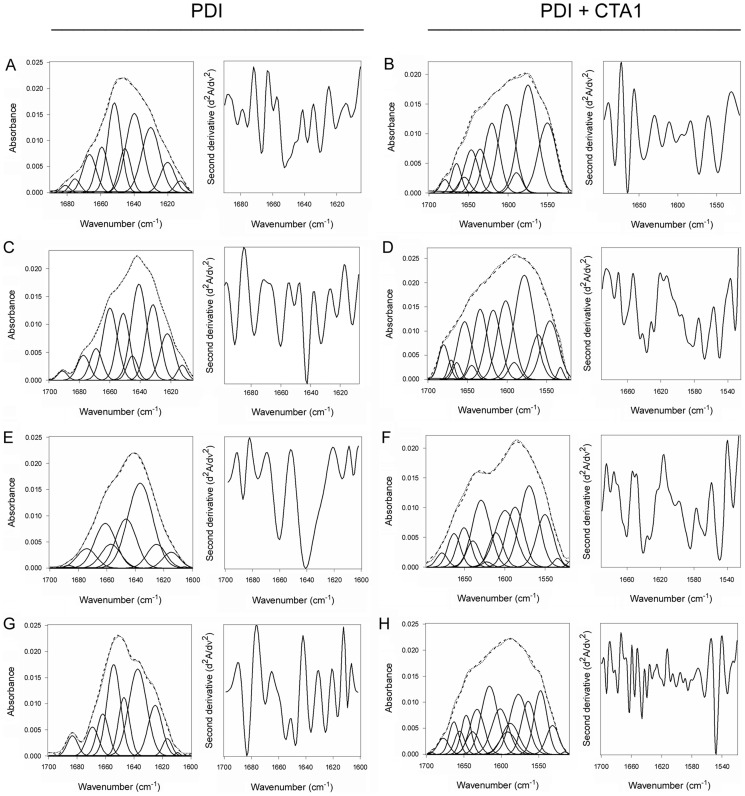
Figure 2. Structure of PDI in the absence or presence of CTA1.
Curve fitting (left panels) and second derivatives (right panels) for the FTIR spectrum of PDI recorded in the absence (A, C, E, G) or presence (B, D, F, H) of 13C-labeled CTA1 are shown. For curve fitting, the dotted line represents the sum of all deconvoluted components (solid lines) from the measured spectrum (dashed line). Unless otherwise noted, all experiments were performed with sodium borate buffer (pH 7.0) containing 1 mM GSH. (A, B) PDI structure at 10°C. (C, D) PDI structure at 10°C in the absence of reductant. (E, F) PDI structure at 37°C. (G, H) PDI structure at 37°C in pH 6.5 buffer.

