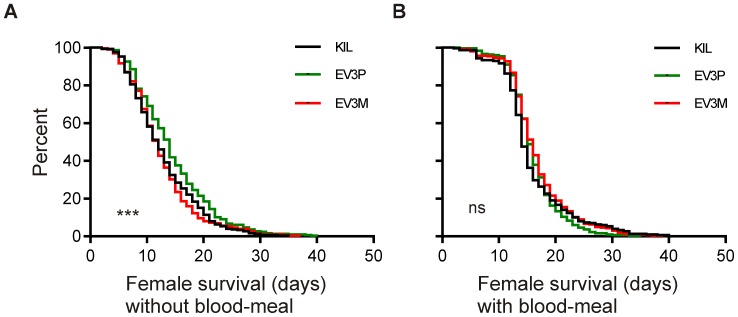
Figure 5. Adult longevity survival curves following mating and blood-feeding.
Graphs represent comparisons between the control KIL (black) and hemizygous transgenic strains EV3P (green) and EV3M (red) and show Kaplan-Meier adult survival curves established with 3 day-old mated females. All survival curves represent pooled data from three independent experiments, each with 4 replicates of 25 adults for each strain. (A) Female survival in the absence of blood-feeding differs significantly between strains (p = 0.0004), with EV3P surviving significantly longer than either KIL (p = 0.002) or EV3M (p = 0.0002). (B) Female survival following blood-meals at days 0 and 5 of the experiment does not differ significantly between strains (p = 0.154). Significance levels are displayed on each graph (***, p<0.0001; *, ns; not significant).

