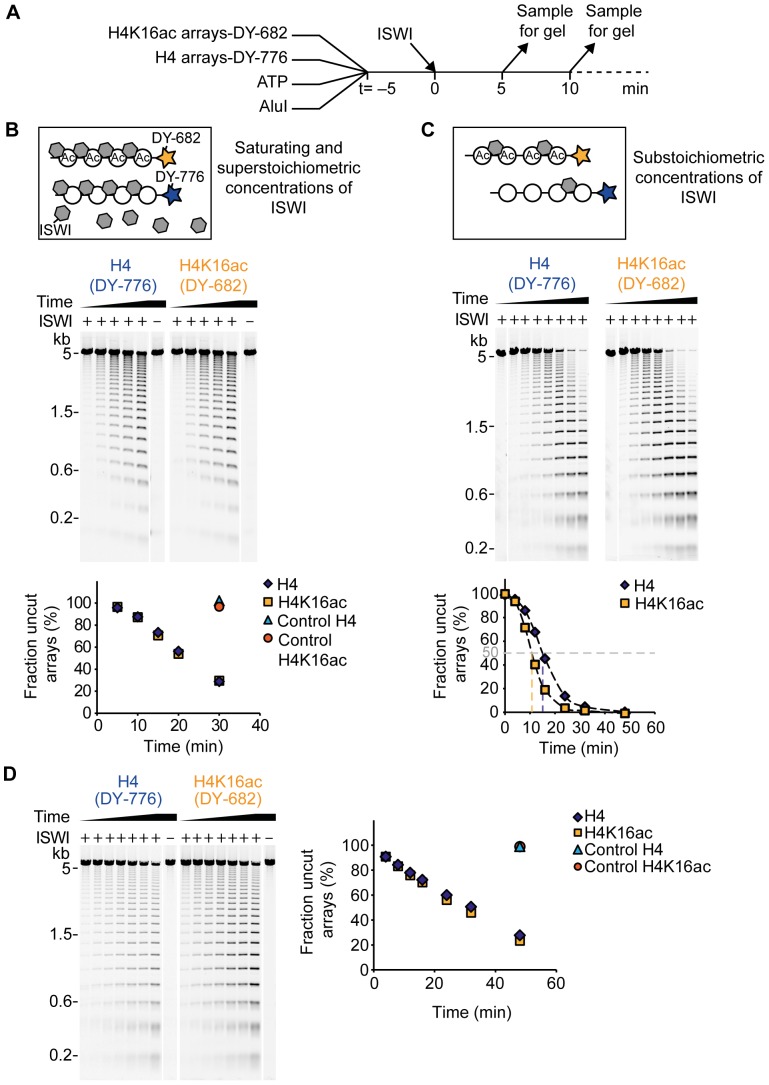
Figure 3. ISWI and ACF remodelling activity is not inhibited by H4K16ac.
(A) Scheme of the remodelling assay. Acetylated (H4K16ac) and unmodified (H4) arrays were labelled at one DNA end with the fluorescent dyes DY-682 and DY-776, respectively. Remodelling reactions contained both array types along with ATP, AluI and the remodeller. Samples of the reaction were taken at different time points (t) and the DNA fragments were analysed on an agarose gel. (B) Top: Schematic depiction of the reaction conditions of the remodelling assay. (Ac: acetylated arrays). Middle: Exemplary result of a remodelling time course with ISWI (500 nM). Nucleosome concentration was 25 nM per array type and ATP concentration was 1 µM. All samples were run on the same agarose gel and the two fluorescent labels were visualized separately by scanning the gel at the respective wave lengths. Lanes were rearranged for presentation purposes. Control reactions did not contain ISWI (–). Bottom: Quantification of remodelling progress. Based on the fluorescent signal intensity the fraction of uncut array DNA was determined for each gel lane and plotted against the remodelling time. (C) Remodelling assay as in B, but with ISWI and nucleosome concentrations of 5 nM and 100 nM, respectively. ATP concentration was 200 µM. In the plot shown in the bottom panel, the remodelling times needed to reach 50% cut array DNA were interpolated by connecting the data points by smooth lines (Excel; Microsoft). (D) Exemplary result of a remodelling time course with ACF. Reaction conditions were as in C. (kb: kilobases).

