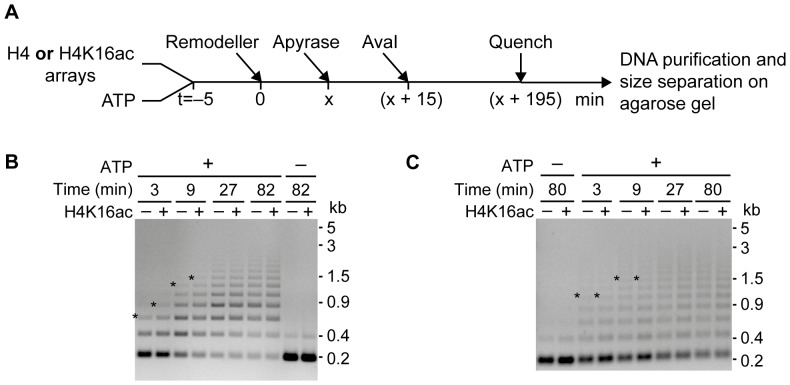
Figure 4. Sliding activity of ISWI and ACF is not reduced by H4K16ac.
(A) Schematic depiction of the sliding assay. Each reaction contained either unmodified (H4) or acetylated (H4K16ac) arrays (30 nM) along with ATP (125 µM) and was started by addition of the remodeller (5 nM). At different time points (x) samples were taken, remodelling was quenched by ATP depletion with apyrase, and AvaI was added. AvaI activity was quenched with EDTA (40 mM) and SDS (0.4%) before purifying the DNA fragments and size-separating them on an agarose gel. (B) and (C) ISWI and ACF sliding time courses, respectively. The asterisks mark the slowest migrating still well visible DNA band in the respective gel lanes. In control reactions ATP was depleted before remodeller addition (– ATP). (kb: kilobases).

