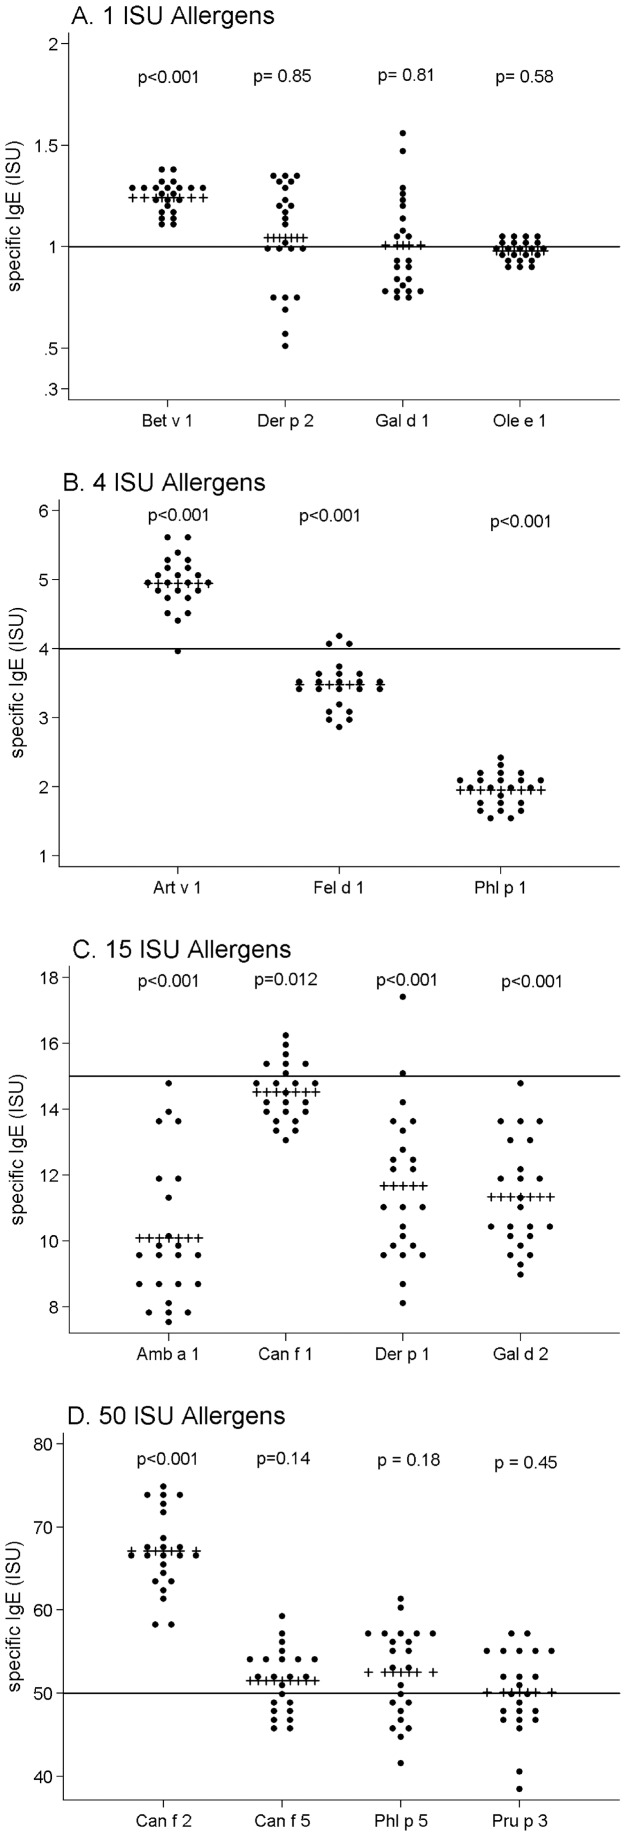
Figure 2. Accuracy of ISAC 112.
Results obtained for the allergens that form the calibration curve with the intra-assay, inter-assay, inter-laboratory and inter-batch determinations performed with the calibrator CTR02, composed by chimeric antibodies. Expected ISU results are depicted by red line and the observed mean ISU results are depicted by red +++. Student T test was used for statistical analysis.

