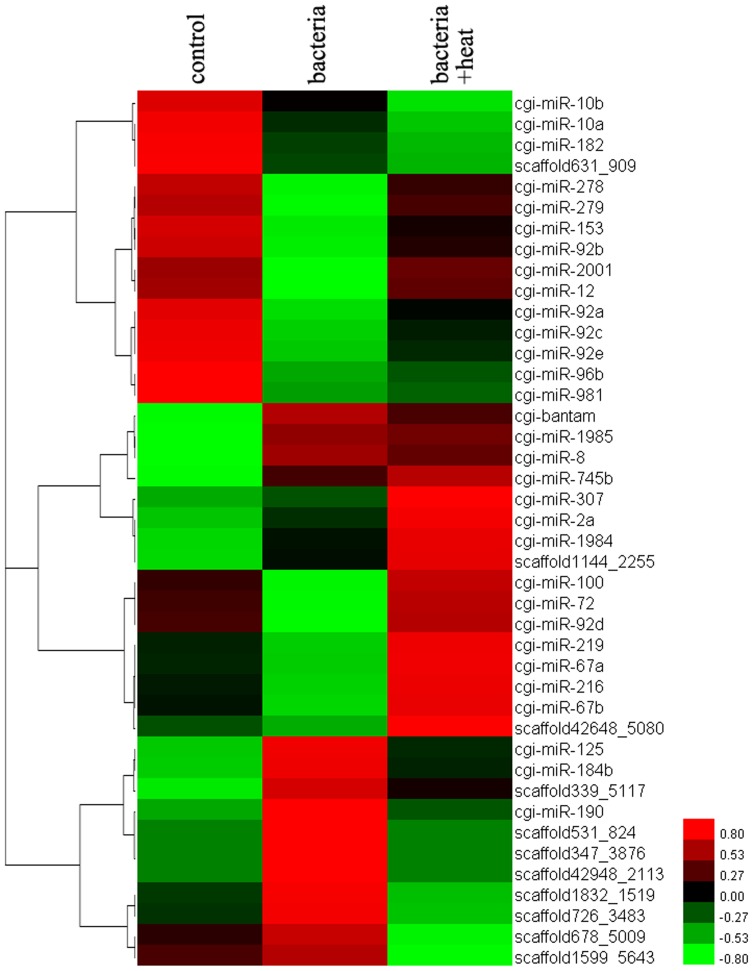
Figure 5. Summary cluster map of miRNAs expression.
The miRNAs all changed significantly between two groups among the control, bacteria and bacteria+heat library. There was the identical alteration trend in the expression level of 9 miRNAs (cgi-miR-2a, cgi-miR-307, cgi-miR-745b, cgi-miR-1984, scaffold1144_2255, cgi-miR-10a, cgi-miR-10b, cgi-miR-182 and scaffold631_909) between the control/bacteria and bacteria/bacteria+heat comparisons. In addition, the alteration trend of other 33 miRNAs expression was contrary between the two comparisons.

