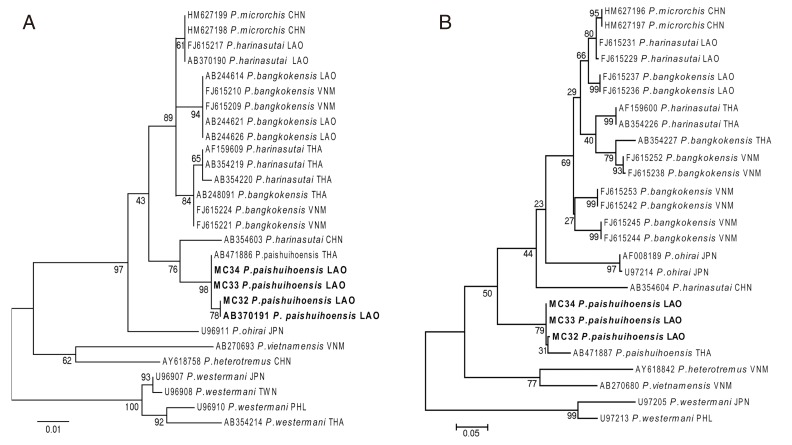
Fig. 2.
The Maximum Likelihood tree constructed from ITS2 (A) and CO1 (B) sequences. Bootstrap scores (percentages of 1,000 replications) are presented for each node. The sequences obtained from the samples in this study are represented in bold, while others from DNA database are shown with the GenBank accession no., species name, and country code.

