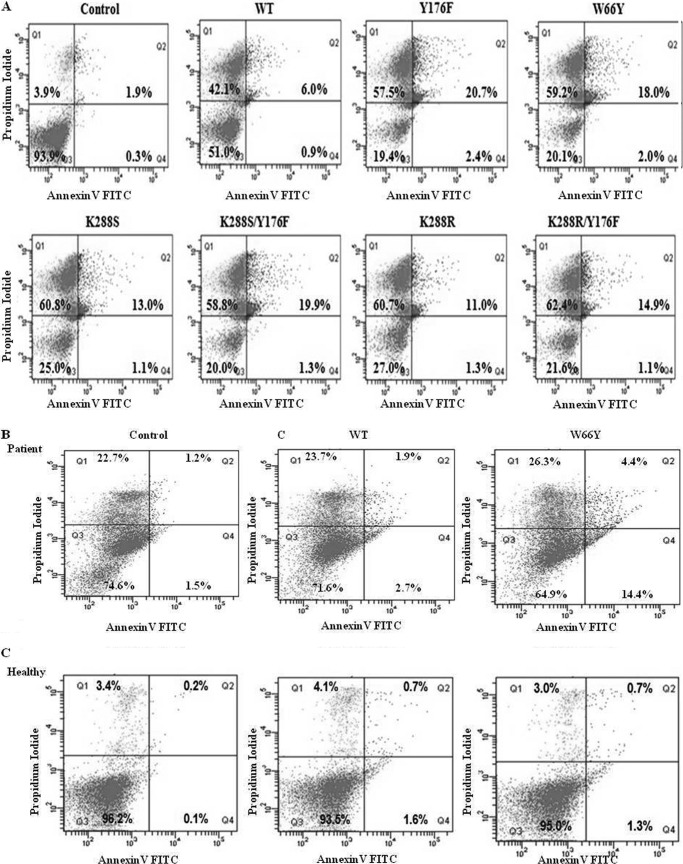
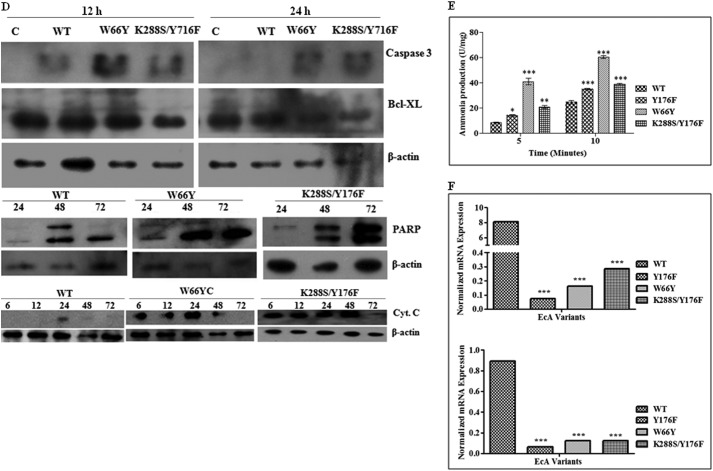
FIGURE 5.
Analysis of apoptosis of MV4:11 and ALL patient lymphoblast cells after treatment with EcA and variants. MV4:11 cells (A), primary lymphoblasts isolated from ALL patients (B), and lymphocytes from healthy individuals (C) were cultured in complete medium for 24 h and then treated with 0.8 units/ml of wild-type EcA and variants for 96 h and analyzed for apoptosis by annexin V binding in flow cytometry. PI stains dead cells with red fluorescence, FITC-annexin V and PI stain apoptotic cells and show green fluorescence, and live cells show little or no fluorescence. Annexin V binding of untreated (control) cells is depicted in upper panel. D, Western blotting of caspase-3, Bcl-XL, cytochrome c, and PARP in MV4:11 cells treated with wild-type EcA, W66Y, and K288S/Y176F (0.8 units/ml) for different periods of time. E, quantification of ammonia production. Wild-type EcA, W66Y, Y176F, and K288S/Y176F variants (20 μg/ml) were incubated with the substrate l-asparagine at 37 °C. After 10 min, the reaction was stopped by adding 1.5 m TCA. The amount of ammonia released was determined by adding Nessler's reagent, and the absorbance was measured from 300 to 600 nm. F, expression of asparagine synthetase transcripts was measured by quantitative real time-PCR. MV4:11 cells were treated with 0.8 units/ml wild-type EcA and variants. RNA was isolated from the treated and untreated cells at different time points. cDNA was synthesized, and the expression of asparagine synthetase was determined using quantitative real time-PCR. Transcript levels are represented relative to mRNA levels of untreated (control) cells. The expression values were normalized with GAPDH. Each experiment was performed three times; means ± S.D. are shown. Significant differences are indicated as follows: *, p < 0.05; **, p < 0.01; ***, p < 0.001.


