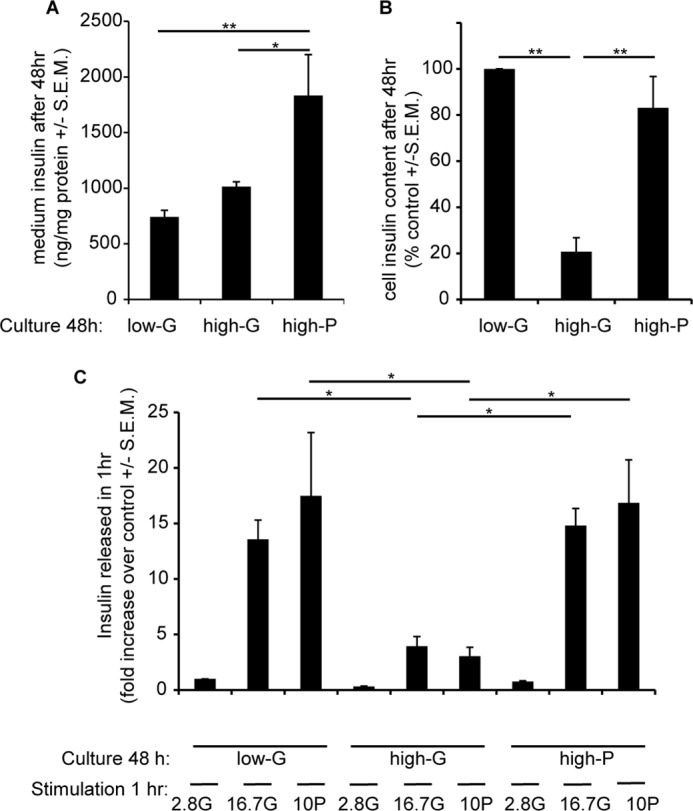
FIGURE 2.

Effects of 48 h of exposure of INS-1 832/13 cells to high glucose or pyruvate on insulin content and release. Cells were cultured for 48 h at 2.8 mm glucose (low-G), 16.7 mm glucose (high-G), or 2.8 mm glucose + 13.9 mm pyruvate (high-P). A, insulin accumulated in the media after the 48-h culture period. B, insulin content after the 48-h culture period. C, fold response of insulin release after returning cells to 2.8 mm glucose medium for 2 h and then stimulating with 16.7 mm glucose or 10 mm pyruvate for 1 h. The data are means ± S.E.M. from three independent experiments performed in triplicate for each condition. *, p < 0.05; **, p < 0.01 (n = 4–5).
