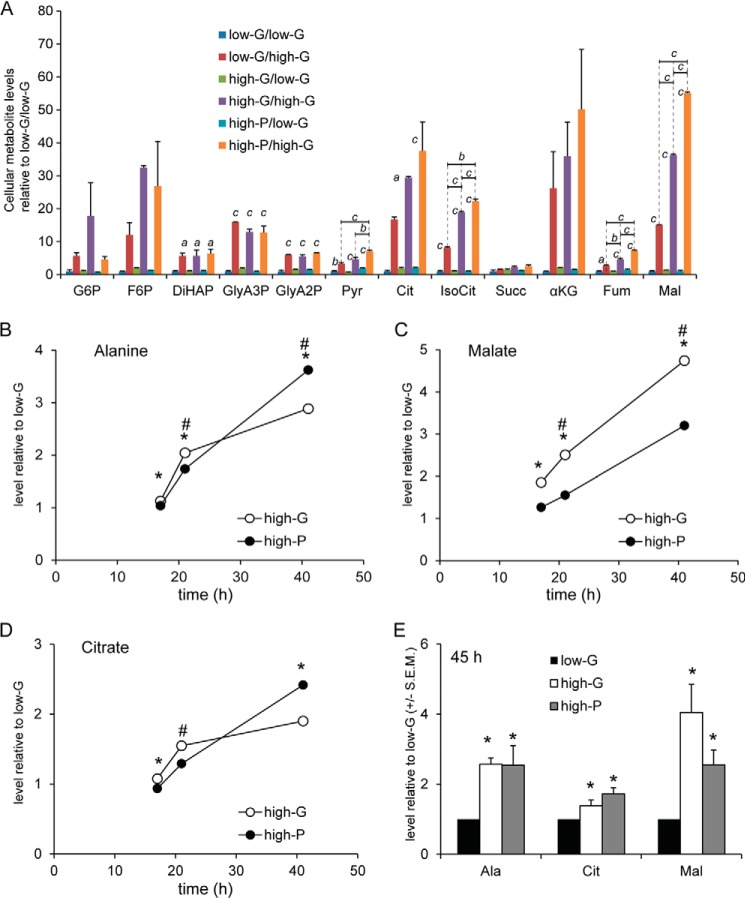
FIGURE 4.
Cellular metabolite levels in low-G, high-G, and high-P cells acutely exposed to 2. 8 mm and 16.7 mm glucose. A, data are expressed as levels relative those in low-G cells exposed to 2.8 mm glucose. Therefore, the level for each metabolite in low-G cells exposed to 2.8 mm glucose is set to the arbitrary level of 1. Comparisons between 2.8 and 16.7 mm glucose (asterisks above bars) or between low-G, high-G, and high-P cells (asterisks above lines) were made by ANOVA followed by Tukey's test. *, p < 0.05; **, p < 0.01; ***, p < 0.001. B–E, selected metabolites were profiled in low-G, high-G, and high-P cells incubated for 17, 21, 41, and 45 h without subsequent preincubation in 2.8 mm glucose and stimulation by 2.8 or 16.7 mm glucose. B–D show changes over time (17–41 h) for alanine (B), malate (C), and citrate (D) levels in high-G and high-P cells, whereas E shows a comparison of the levels of each metabolite at 45 h. At 45 h, there were no significant differences between high-G and high-P cells for any metabolite, whereas metabolite levels were increased compared with levels measured in low-G cells. The data were normalized to low-G cells and the protein level. Statistical significance was assessed by the Mann Whitney U test (B–E). *, p < 0.05 high-G versus low-G; #, p < 0.05 high-P versus low-G. LG, 2.8 mm glucose; HG, 16.7 mm glucose; Pyr, 13.9 mm pyruvate; Succ, succinate; Ala, alanine; Mal, malate; Cit, citrate; αKG, α-ketoglutarate; Fum, fumarate; IsoCit, isocitrate; G6P, glucose-6-phosphate; F6P, fructose-6-phosphate; DiHAP, dihydroxyacetonephosphate; GlyA3P, glyceraldehyde-3-phosphate 3; GlyA2P, glyceraldehyde-3-phosphate 2. Means ± S.E.M. of three independent experiments are given for all experiments.

