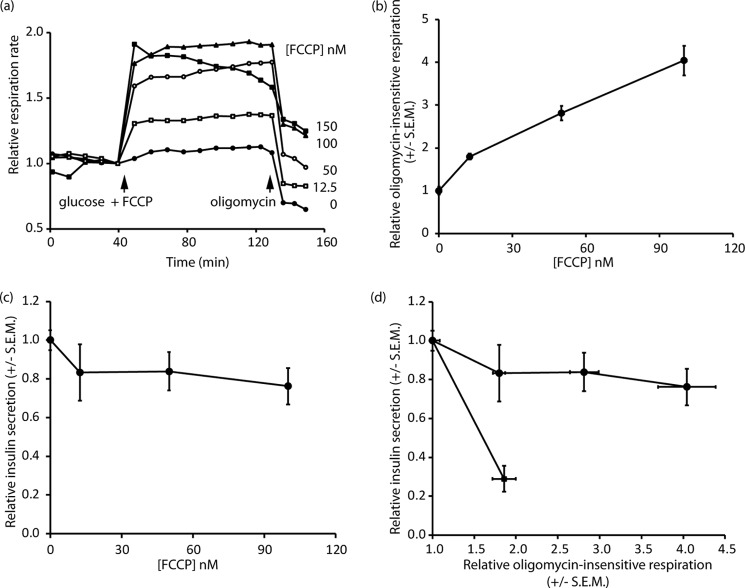
FIGURE 7.
Induced proton leak and determinations of respiration and insulin secretion. Respiration and insulin release were monitored in low-G cells in response to the addition of 16.7 mm glucose accompanied by varying concentrations of FCCP (0–150 nm). The 150 nm FCCP trace showed declining respiration and was not further considered. a, relative respiratory rates; oligomycin was added to inhibit the ATP synthase to allow the proton leak to be estimated. b, proton leak as a function of FCCP concentration. c, insulin secretion assayed from the Seahorse well supernatants as a function of FCCP concentration. d, cross-correlation between proton leak and relative insulin secretion in the presence of FCCP (circles) and for chronic high glucose cultured cells relative to low glucose controls (square). The data are means ± S.E.M. of three to six independent experiments.

