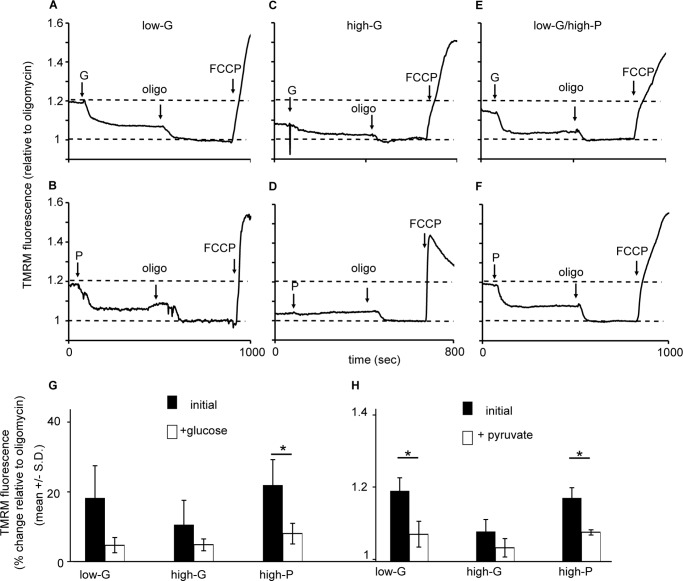
FIGURE 8.
Mitochondrial membrane potential responses of low-G, high-G, and high-P cells to high glucose or pyruvate, and oligomycin. A–F, cells incubated in buffer with 2.8 mm glucose for 2 h in the presence of TMRM+. At the indicated times cells were stimulated with 16.7 mm glucose (G) or 10 mm pyruvate (P), followed by 4 μg/ml oligomycin (oligo) and 4 μm FCCPs. A and B, glucose (A) and pyruvate stimulation (B) in low glucose-cultured cells. The data presented are representative examples from a total of three to seven experiments. G, means ± S.D. for glucose stimulation. H, means ± S.D. for pyruvate stimulation. *, p < 0.05.

