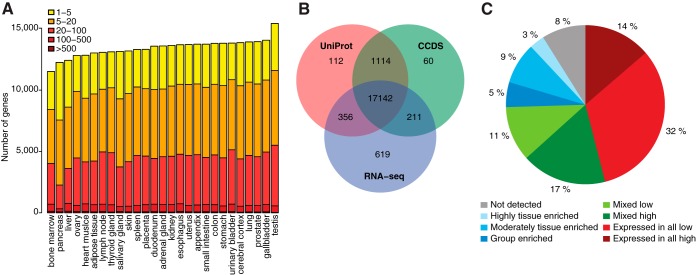
Fig. 2.
The classification of all human protein-coding genes with regards to transcriptional levels in 27 tissues. A, The total number of genes with detected transcripts in each cell type using five different abundance levels for FPKM values; 1–5 FPKM (yellow), 5–20 FPKM (orange), 20–100 FPKM (light red), 100–500 FPKM (red), >500 FPKM (dark red). B, Venn-diagram showing the overlap between a total of 20,083 human Ensembl genes based on three different datasets: (1) genes detected in one or more tissues used in this study (RNA-seq), (2) the core set of genes defined by the Consensus CDS project (CCDS), (3) genes with transcript or protein evidence in UniProt. C, Piechart showing the distribution of all 20,050 genes into eight different categories based on the transcript abundance as well as the number of detected tissues.

