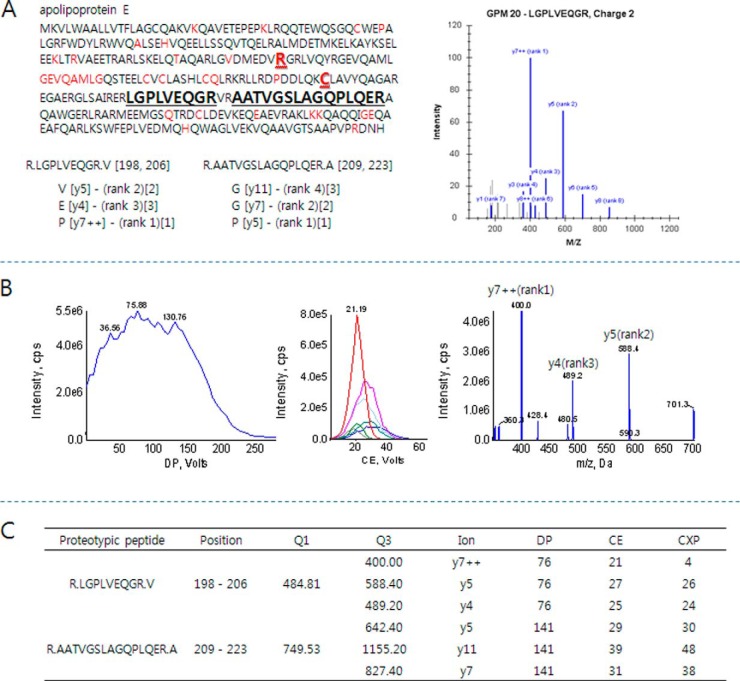
Fig. 1.
A representative optimization scheme of a proteotypic peptide (LGPLVEQGR) of ApoE for SRM quantification. A, two proteotypic peptides (bold black) were selected to determine ApoE levels in sera. The peptides representing different isoforms (bold red), ApoE2 and ApoE4, and mutant sequences by single-nucleotide polymorphism (red) were excluded. Highly intense SRM transitions were collected from the GPM database (bracket with rank) and used to select the three most intense transitions for SRM quantification. The three transitions are depicted in square brackets. B, SRM optimization for highly sensitive measurement. The dominant charge state, [M+2H]2+, of the peptide was used to determine the optimized DP value by ramping DP voltage (left). Q1/Q3 scan with a CE voltage ramp was conducted to determine the optimized CE values for each selected transition (middle). Final product ions were collected after optimizing instrumental parameters (right). The three most intense y-ions, y7++, y5, and y4, were selected for further SRM quantification. C, instrumental parameters for the transitions of proteotypic peptides.

