
Fig. 3.
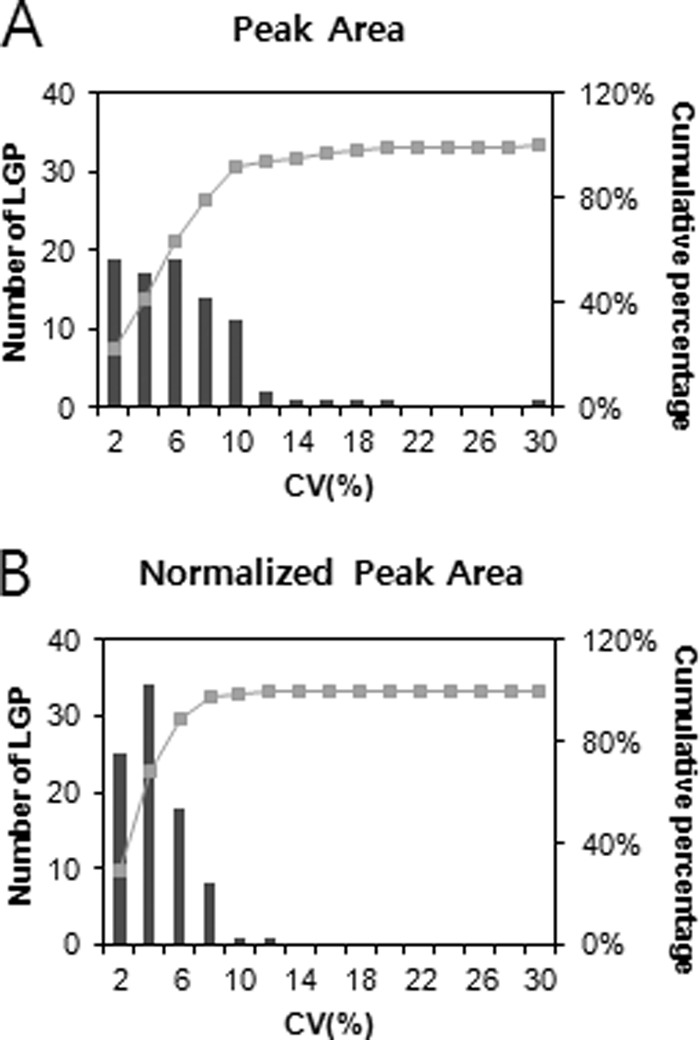
Analytical reproducibility of LGPLVEQGR for 88 samples in SRM. Cumulative frequencies of 88 samples are shown by using raw peak area (top) and normalized peak area to heavy peptide (bottom). The most intense y-ion, y7++, of LGPLVEQGR was used for the measurement.