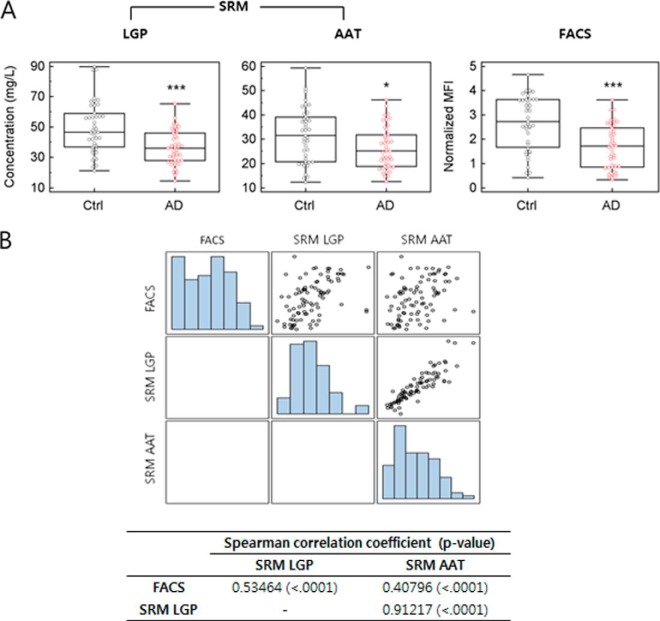
Fig. 5.
Serum ApoE levels of 43 controls (black) and 45 AD patients (red) were analyzed by SRM and FACS. For SRM measurement, the highly intense y-ions, y7++ of LGPLVEQGR (LGP) and y5 of AATVGSLAGQPLQER (AAT), of two proteotypic peptides representing ApoE were used. A, serum ApoE levels of AD patients were compared with those of controls. B, correlation study between results from SRM and FACS analysis.

