
Fig. 6.
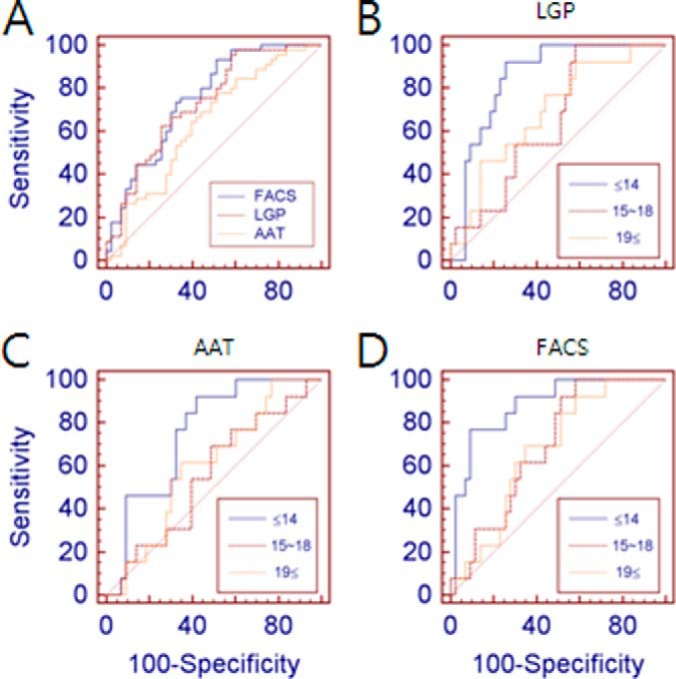
ROC curves generated based on serum ApoE levels in control and AD subjects. A, ROC curves were obtained using results from SRM (LGP, LGPLVEQGR; AAT, AATVGSLAGQPLQER) and FACS-based serum ApoE quantification. AUC-ROCs for serum ApoE levels in AD by LGP SRM, AAT SRM, and FACS analysis were 0.731, 0.637, and 0.752, respectively. B–D, ROC curves were used to investigate the correlation between serum ApoE levels and MMSE score in three sets of ApoE quantifications. AUC-ROCs of serum ApoE levels for MMSE scores ≤ 14 (severe AD) were 0.850, 0.753, and 0.884 in LGP SRM, AAT SRM, and FACS analysis, respectively.