Fig. 2.
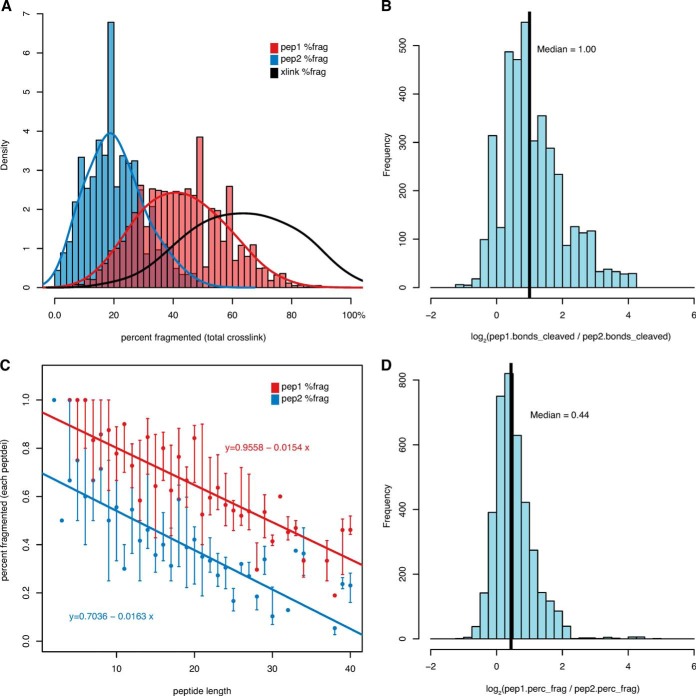
The number of bonds cleaved from DSS cross-links are unevenly distributed between the two component peptides. 3885 cross-link spectral matches from RNA pol II analysis matched by Protein Prospector. A, the higher scoring peptide (red) contributes twice as many cleaved bonds as the lower scoring peptide (blue) relative to the number of bonds in the crosslink. B, for each cross-link, peptide 1 contributes twice as many cleaved bonds as peptide 2 (median log2 ratio = 1.0). C, the percentage of bonds cleaved within each peptide has an inverse relationship to peptide length, with peptide 1 fragmenting 36% more efficiently at a given length. D, within each cross-link, peptide 1 fragments 35% more efficiently than peptide 2 (median log2 ratio = 0.44). Percent fragmented figures in D were corrected for peptide length using the slope of the regression line in C.

