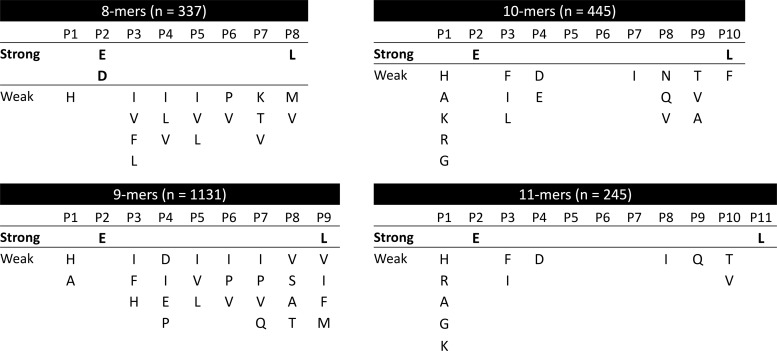
Fig. 4.
Fine mapping of the B*40:02 binding motif. Residues statistically overrepresented (p < 0.05 after multiple testing correction) at any peptide position are shown ordered downward according to their fobs/fexp ratio. Binding motifs were arbitrary classified as strong (fobs/fexp > 5) or weak (fobs/fexp < 5).

