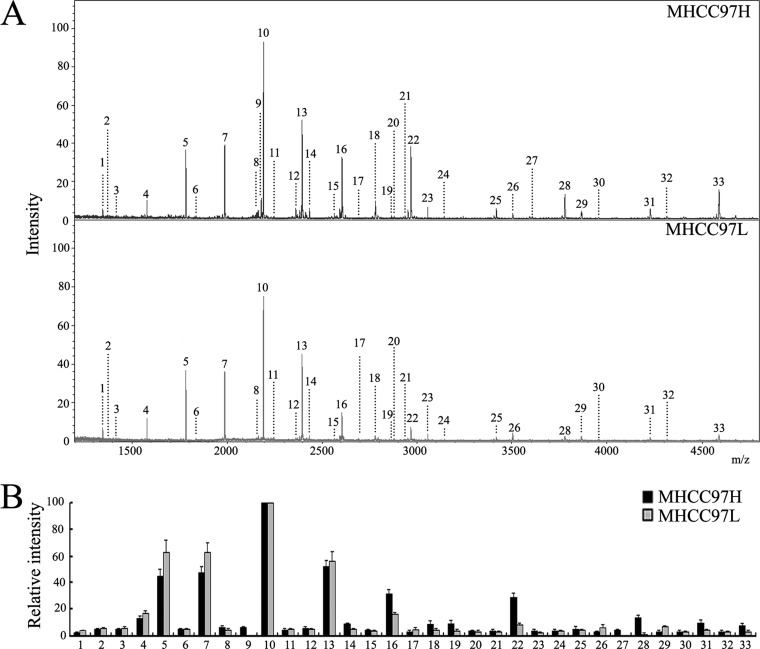
Fig. 1.
Differential N-glycan composition of MHCC97H and MHCC97L cell lines. A, MALDI-TOF-MS spectra of permethylated N-glycans released from MHCC97H and MHCC97L cells. B, histograms of relative intensities of the differential glycan signals observed. Values are mean ± S.D. for three permethylated samples from N-glycan samples. The signals indicated with Arabic numerals are summarized in Table III.

