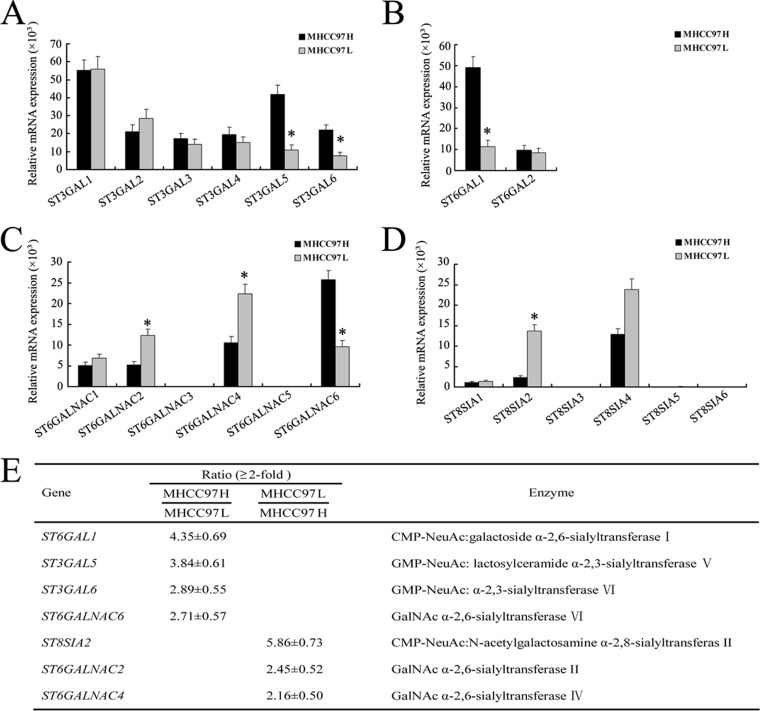
Fig. 2.
Differential expression of ST gene family in MHCC97H and MHCC97L cell lines. A–D, the mRNA levels of the ST gene family analyzed via real-time PCR. The relative amount of gene mRNA was normalized to the GAPDH level. E, relative intensity ratios (≥2-fold) of the glycogene signals observed. MHCC97H cells expressed higher levels of ST6GAL1, ST3GAL5, ST3GAL6, and ST6GALNAC6 mRNA, whereas MHCC97L cell types expressed higher levels of ST8SIA2, ST6GALNAC2, and ST6GALNAC4 mRNA (*p < 0.05). Data are the means ± S.D. of triplicate determinants.

