Fig. 6.
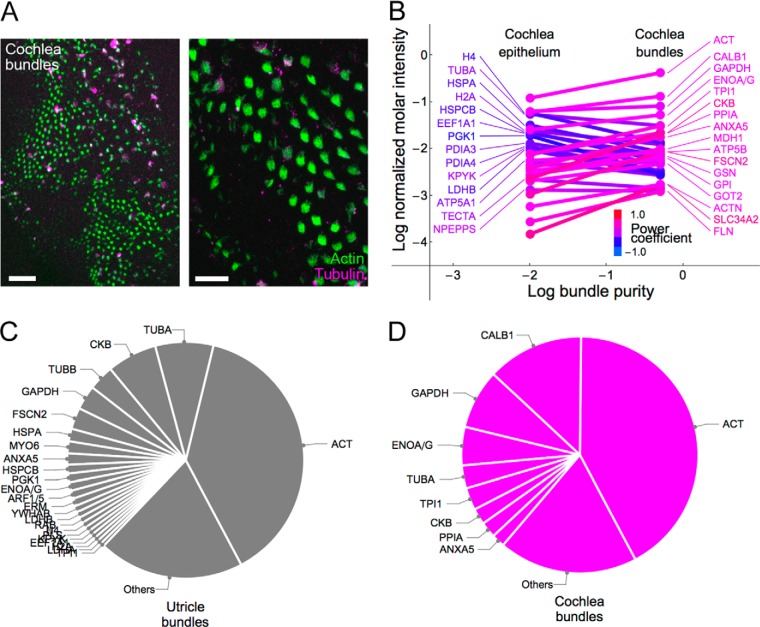
Chick cochlea hair bundle proteins. A, Isolated chick cochlea hair bundles, stained with phalloidin (green) to highlight stereocilia and anti-tubulin (magenta) to show contamination and kinocilia. Note recovery of bundles is variable from region to region and there is significant contamination in some areas. Left panel scale bar, 100 μm; right panel scale bar, 20 μm. B, Mole fractions of proteins in cochlear epithelium (left) and bundle (right); the slope of the line connecting them represents bundle-to-epithelium enrichment. Proteins most highly enriched in the epithelium are indicated at left, whereas bundle-enriched proteins are at right. Hue represents relative enrichment (power coefficient of fit connecting points) for each protein. C, Utricle bundle proteins; the most abundant proteins that collectively account for ∼80% of the total im are labeled. The last twelve protein symbols, which overlap in the figure, are ARF1/5, ERM, YWHAB, LDHB, RAB, H4, PLS, KPYK, EEF1A1, H2A, LDHA, and TPI1. D, Cochlea bundle proteins; those accounting for ∼80% of the total im are indicated.

