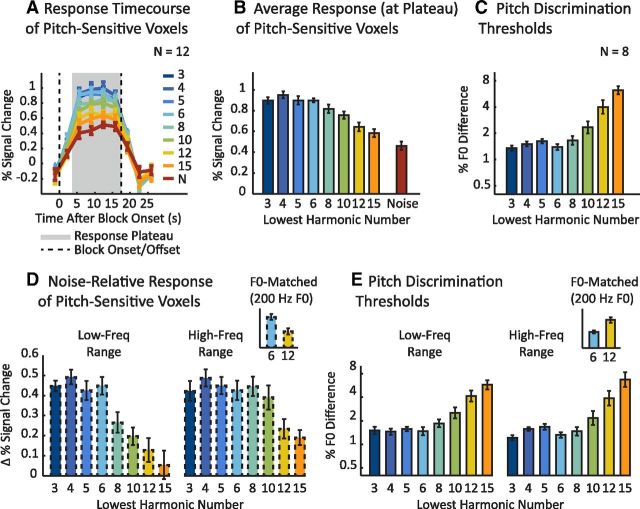
Figure 3.
Response of pitch-sensitive voxels to resolved and unresolved harmonics with corresponding behavioral discrimination thresholds. A, The signal-averaged time course of pitch-sensitive voxels to each harmonic and noise condition collapsing across the two frequency ranges tested. The numeric labels for each harmonic condition denote the number of the lowest harmonic of the notes for that condition (see Fig. 2A for reference). The average time course for each condition contained a response plateau (gray area) extending from ∼5 s after the block onset (dashed vertical line) through the duration of the stimulus block. Pitch-sensitive voxels were identified in each individual subject by contrasting all harmonic conditions with the noise conditions. B, Mean response to each condition shown in A, calculated by averaging the four time points in the response plateau. C, Pitch discrimination thresholds for the same conditions shown in A and B measured in a subset of eight subjects from the imaging experiment. Lower thresholds indicate better performance. D, The mean response difference between each harmonic condition and its frequency-matched noise control condition plotted separately for each frequency range. The inset highlights two conditions that were matched in average F0 (both 200 Hz) but differed maximally in resolvability: a low-frequency condition with low-numbered resolved harmonics (left bar, blue) and a high-frequency condition with high-numbered unresolved harmonics (right bar, yellow). E, Pitch discrimination thresholds for each harmonic condition plotted separately for each frequency range. The inset plots discrimination thresholds for the same two conditions highlighted in D. Error bars indicate one within-subject SEM.

