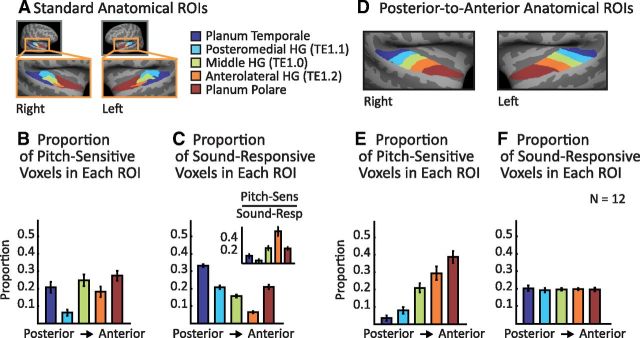
Figure 4.
Anatomical distribution of pitch responses across auditory cortex. A, Standard anatomical ROIs displayed on an inflated average brain. B, Proportion of pitch-sensitive voxels in the superior temporal plane falling within each ROI. Pitch-sensitive voxels were identified by contrasting harmonic and noise conditions (see Fig. 5 for resolvability effects). C, Proportion of all significant sound-responsive voxels falling in each ROI. Sound-responsive voxels were defined by contrasting the response to all 18 harmonic and noise conditions with silence. Inset shows the proportion of sound-responsive voxels in each ROI that exhibited a pitch response and thus provides a measure of the density of pitch responses in each ROI. D, Novel set of anatomical ROIs designed to run along the posterior-to-anterior axis of the superior temporal plane and to each include an equal number of sound-responsive voxels. E, Proportion of all pitch-sensitive voxels falling within each posterior-to-anterior ROI. F, Proportion of all significant sound-responsive voxels falling in each posterior-to-anterior ROI. Error bars indicate within-subject SEM.

