
Figure 3.
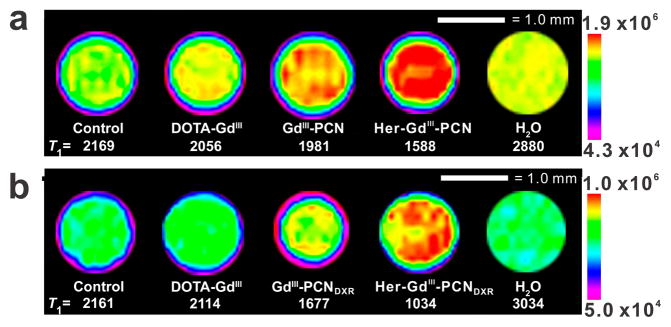
T1-weighted MR images (at 9.4 T and 25 °C) of SK-BR-3 cells incubated for 24 h with media alone (control) or with Gd-containing ([GdIII] = 50 μM) formulations (free DOTA-GdIII, GdIII-PCN, or Her-GdIII-PCN), with (a) and without (b) DXR. The maximum and minimum signal intensities are shown in the color-mapped calibration bar on the right side of each image.