
Fig. 4.
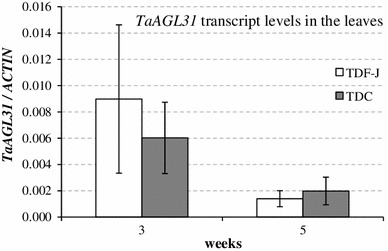
Comparison of TaAGL31 transcript levels in the leaves of TDF-J (Vrn-D4) and TDC (vrn-D4) at two different time points. Transcript levels are expressed as linearized fold-ACTIN levels calculated by the formula . Error bars are SE of the means calculated from six biological replications