
Table 1.
Graphical representation of haplotypes in the critical recombinants
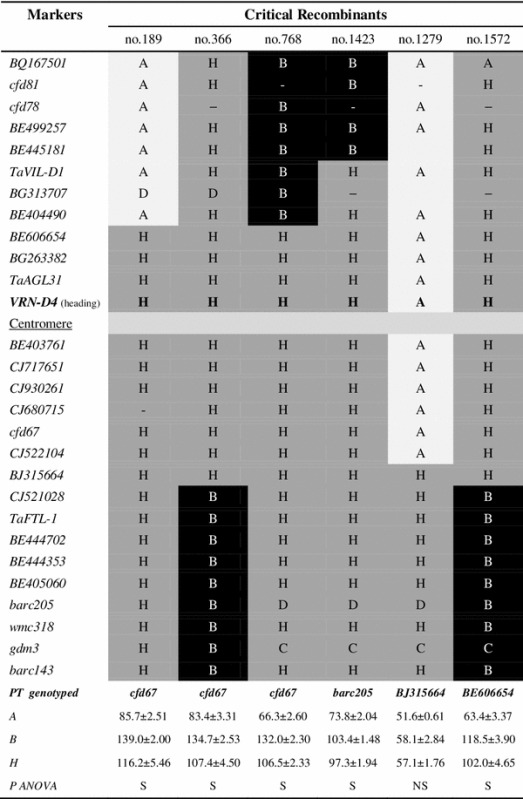
A change in cell color indicates a recombination event. Heading time of each genotypic class is shown as mean ± standard error of the mean at the bottom of the Table (the heterozygous marker used to genotype the progeny test (PT) is indicated above)
A TDF-J, B CS(5D5402), H heterozygous, C B or H, D A or H, S significant (P < 0.0001), NS on-significant