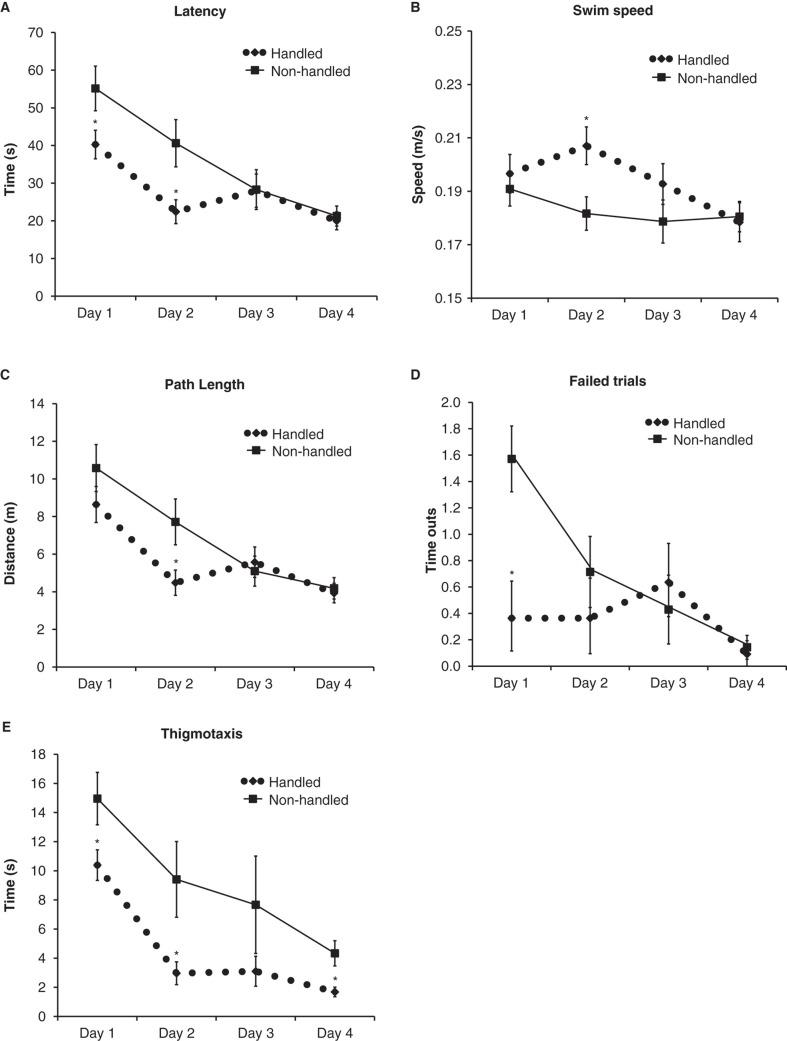
Figure 1.
Results from the learning trials in the MWM presented as means ± standard error of the mean. *p < 0.05, **p < 0.01, n = 14 per group. A: The mean latency to find the hidden platform for each trial day, where handled animals had shorter latency on days 1 and 2. B: The distance the animal swam (path length). C: The number of failed trials (time-outs). D: The swim speed. E: The thigmotaxis as defined as time spent within 15 cm of the pool wall.

