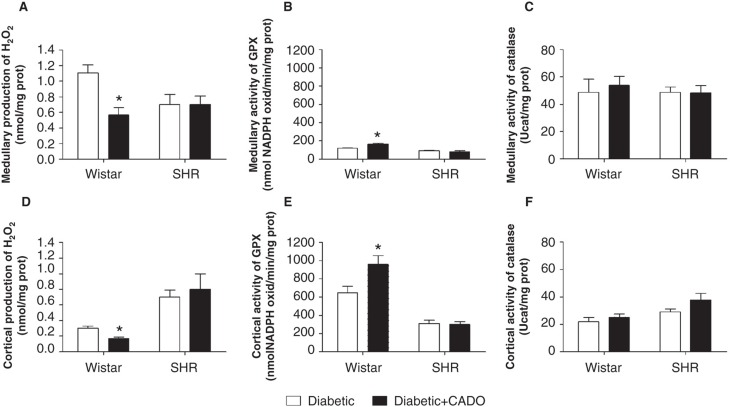
Figure 4.
Production of hydrogen peroxide (H2O2) and activity of H2O2-neutralizing enzymes in the kidney of diabetic-Wistar and SHR rats treated (▪) or not (□) with 2-chloroadenosine (CADO). A: renal medullary H2O2 production (n = 6–8; nmol/mgprot); B: renal medullary glutathione peroxidase (GPx) activity (n = 5–6; nmolNADPH/min/mgprot); C: renal medullary catalase activity (n = 5–8; Ucat/mgprot); D: renal cortical H2O2 production (n = 5–7; nmol/mgprot); E: renal cortical GPx activity (n = 5–6; nmolNADPH/min/mgprot); F: renal cortical catalase activity (n = 5–8 Ucat/mgprot). Results expressed as Mean±SEM. *p <0.05 versus corresponding diabetic group.
Results expressed as mean ± SEM; *p < 0.05 versus corresponding diabetic group.

