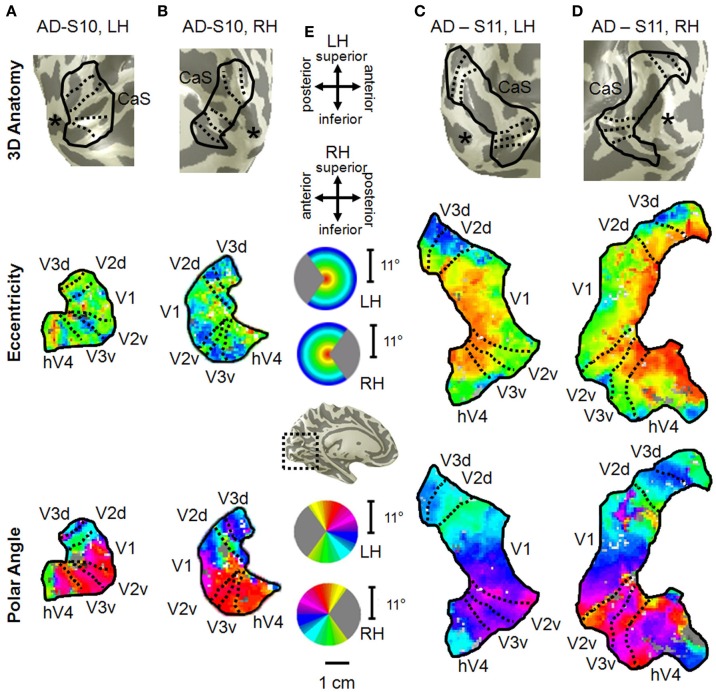
Figure 10.
Visual field map measurements in mild Alzheimer's disease subjects. Occipital VFMs V1, V2, V3, and hV4 are shown for the left (A) and right (B) hemispheres of a single subject with mild AD (S10). While the polar angle gradients (bottom panel) still contained the expected representations of contralateral visual space with orderly reversals between VFMs, the eccentricity measurements (middle panel), drawn from the same fMRI scans, were more disorganized. Also note the visibly smaller size of these VFMs in this subject compared to those shown for young and healthy aging subjects in Figure 2. A second set of VFMs is also shown for the left (C) and right (D) hemispheres from a second subject (S11) with mild Alzheimer's disease. This AD subject displayed more normal VFM sizes and foveal eccentricity representations, but also has visible changes in the peripheral eccentricity representations. (E) Legends and scale bar. Other details are as described in Figure 2. The “*” denotes the occipital pole.

