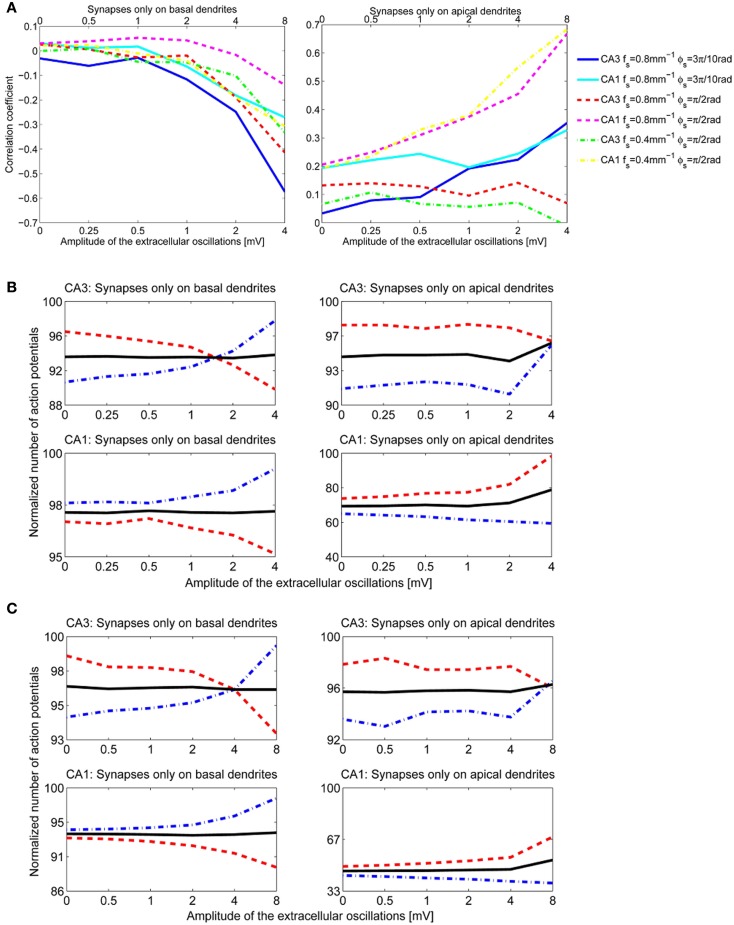
Figure 10.
(A) The correlation coefficients between the bins of 1 ms width and the phase of the extracellular oscillations. Extracellular oscillations with several different spatial properties for the CA3 and the CA1 neuron models are used. (B) The number of action potentials as a function of the amplitude when fs = 0.8 mm−1 and ϕs = rad. (C) The number of action potentials as a function of the amplitude when fs = 0.4 mm−1 and ϕs = rad.

