
Figure 8.
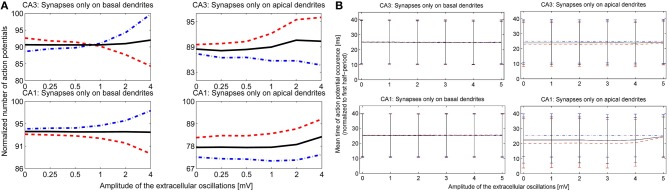
(A) The number of action potentials as a function of the amplitude of the extracellular oscillations, with the frequency of 10 Hz and for the medium firing rate (5 < F < 15 Hz). The results for the CA3 neuron models are shown in the first row and for the CA1 in the second row. The curves are obtained from results of 240 simulations (48 iterations for 5 morphologies) with 1 s duration. The results during the positive period w.r.t. the potential at the soma, are shown with red dashed lines, and during the negative period with blue dot-dashed lines and the average number of the action potentials is shown with solid black lines. (B) The mean timing of the action potentials with the standard deviations. The x-axis denotes the amplitude of the 10 Hz extracellular oscillations. To facilitate the visual comparison, we subtracted 50 ms from the negative half-wave mean timing (blue dash-dotted lines).