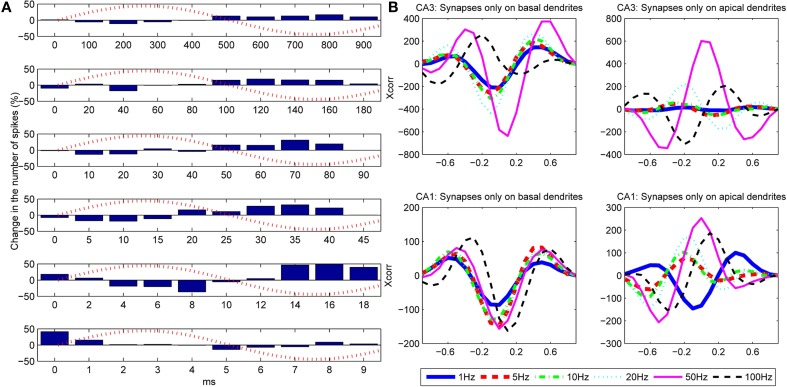
Figure 9.
(A) Influence of the frequency of the extracellular oscillations on the number of action potentials for the stimulation of the basal dendrites of the CA3 neuron model. From top to bottom the plots correspond to the following frequencies: ft = 1, 5, 10, 20, 50 and 100 Hz. The bins are created by cumulating the results over 1 s of simulation. (B) Cross-correlation between the difference of the bins (cumulated over a single period of the extracellular oscillations) and the extracellular oscillations. The cross-correlation is computed for six different frequencies of the extracellular oscillations.

