
Figure 4.
Identification of Mesenchymal-like and Epithelial-like States in Nontransformed MCF10A Cells
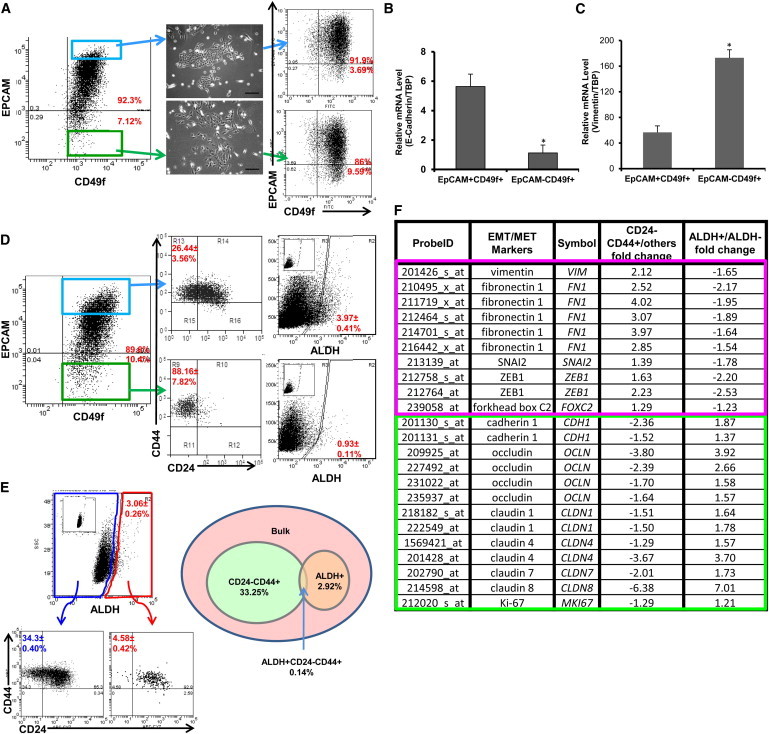
(A) Cells were immunostained with EPCAM and CD49f antibodies. EPCAM+CD49f+ and EPCAM−CD49f+ cells were separated by FACS and plated in culture for 10 days. FACS analysis for EPCAM and CD49f was then repeated. Scale bar, 200 μm.
(B and C) Total RNA was extracted from the sorted EPCAM+CD49f+ cells and EPCAM−CD49f+ cells, and the expression level of E-cadherin, vimentin, and TATA-binding protein (TBP) was measured by qRT-PCR. ∗p < 0.05; error bars represent mean ± SD.
(D) Cells were immunostained with EPCAM and CD49f antibodies, and subsequently stained with CD24/CD44 or ALDEFLUOR. Inset displays the negative control; cells incubated with DEAB, the specific inhibitor of ALDH, were used to establish the baseline fluorescence of these cells.
(E) Cells were immunostained with CD24 and CD44 antibodies, and subsequently with ALDEFLUOR. The four cell subpopulations defined by the ALDEFLUOR and CD24−CD44+ phenotypes were separated by FACS. The percentages shown in the diagram depict cell subpopulations and the overlap between the ALDEFLUOR-positive phenotype and the CD24−CD44+ phenotype. Inset displays the negative control; cells incubated with DEAB, the specific inhibitor of ALDH, were used to establish the baseline fluorescence of these cells.
(F) Total RNA was extracted from the four populations as described in (E) and used for Affymetrix array (HU133 Plus 2.0) analysis. The fold change for EMT/MET markers was compared among ALDH+, ALDH−, CD24−CD44+, and others.
See also Figure S4.