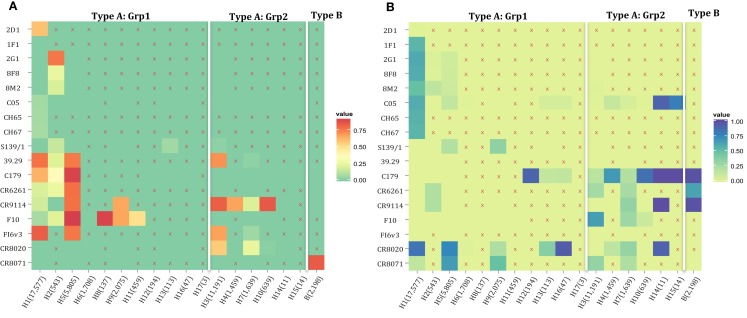
Figure 8.
The neutralized and escape motif coverage on each subtype within FLUKB of neutralizing antibodies. The heat map of (A) neutralized and (B) escape coverage are shown. Each cell on the grid represents coverage for a specific antibody (row name) on specific subtype (column name). The subtypes were sorted from Grp1 and Grp2 in influenza A virus, and influenza B virus. Different color schemes were used in order to differentiate neutralizing and escape coverage: from green to red/green to blue indicate rising neutralizing/escape coverage in HA sequence dataset. The boxes with symbol “X” indicate that no experimental validation data were available for this study.

