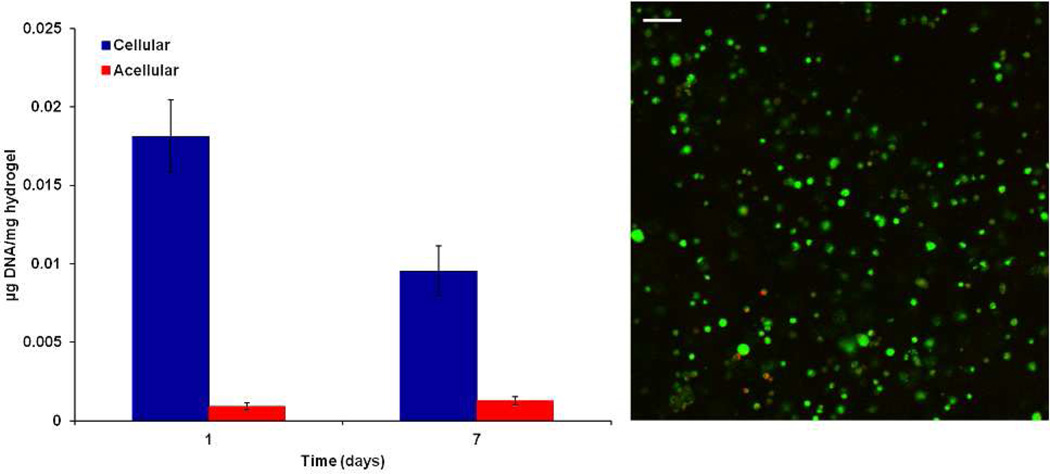
Figure 12.
DNA content of acellular and cellular 10 wt % hydrogels with predifferentiated MSCs at an encapsulation density of 10 million cells/mL hydrogel at 1 and 7 days. A representative confocal micrograph of a cellular hydrogel with Live/Dead staining at 7 days. Green and red staining indicate live or dead cells, respectively. Data are reported as means ± standard deviation for a sample size of n = 4. The scale bar represents 100 µm.

