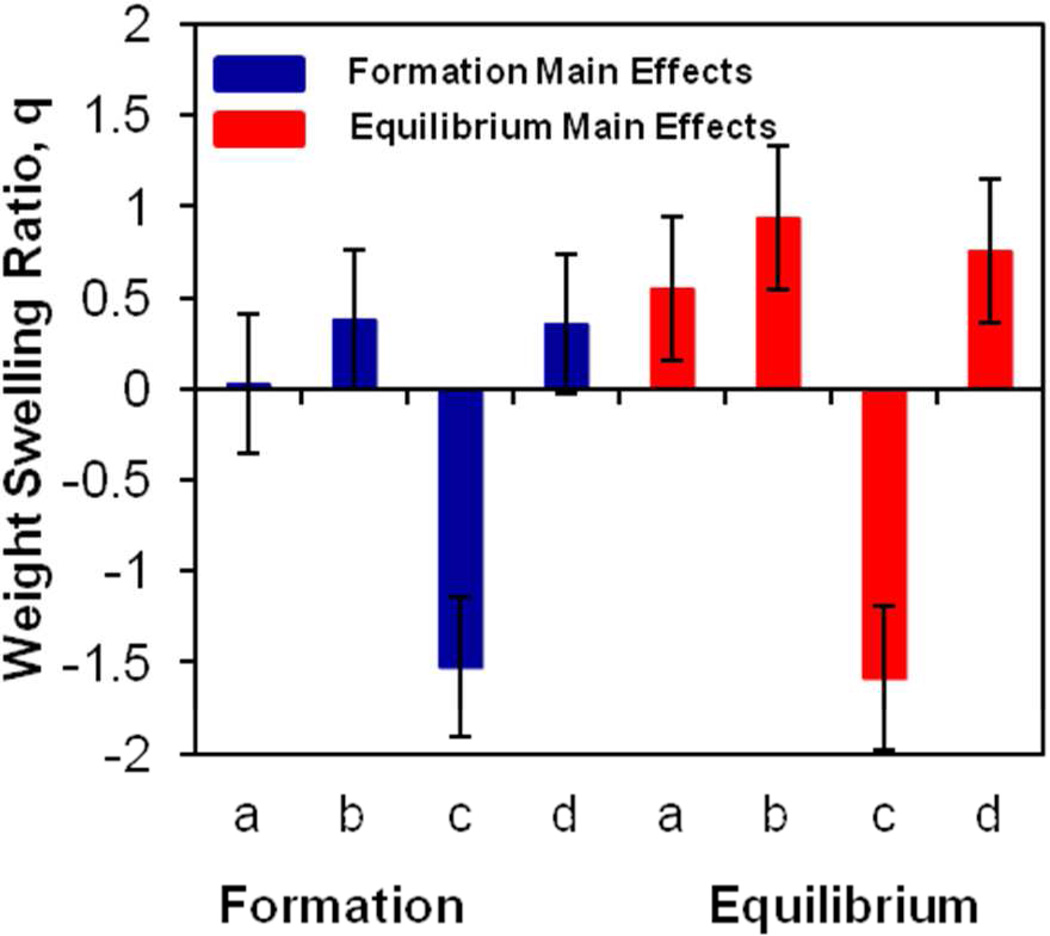
Figure 6.
Main effects for formation and equilibrium weight swelling ratios from 24 full factorial study. The effects a, b, c, and d correspond to the parameters DBA mol content, PAMAM molecular weight, TGM wt %, and amine:epoxy mol ratio, respectively. The error bars represent the standard error from the overall population mean. Significant effects are indicated by error bars that do not cross the x-axis.

