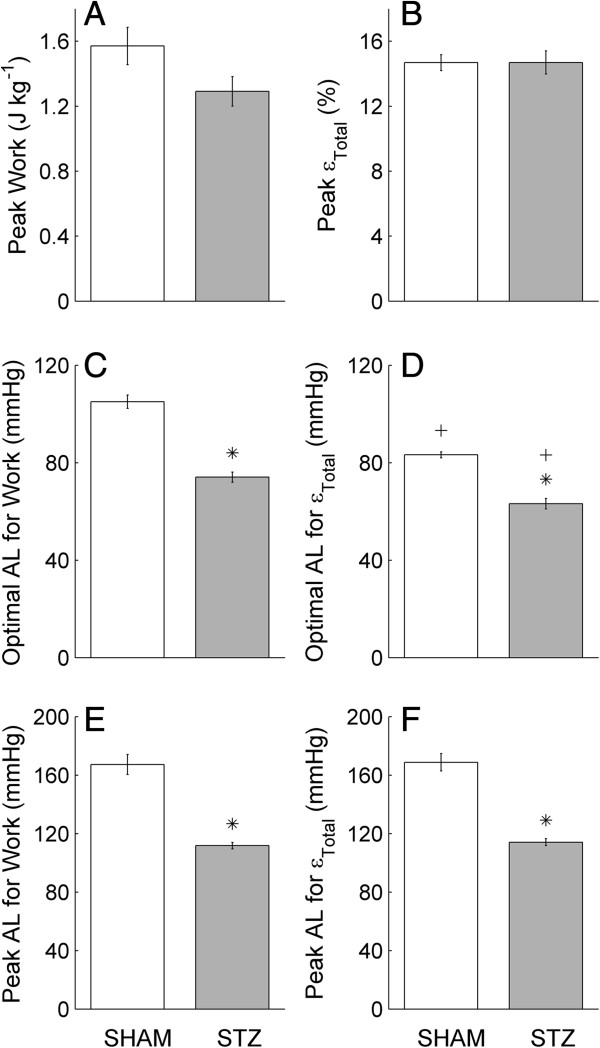
Figure 5.
Peak work, peak total efficiency, optimal afterloads and peak afterloads. Quantification of the average relations shown in Figure 4B and F: peak work (A), peak total efficiency (εTotal; B), the optimal afterload (AL) for work (C) and for εTotal(D) and the peak afterload for work (E) and for εTotal(F). Values represent the mean ± SE of n = 17 SHAM hearts and n = 16 STZ hearts. *P < 0.05, STZ versus SHAM; +P < 0.05, optimal AF for work versus that for εTotal.

