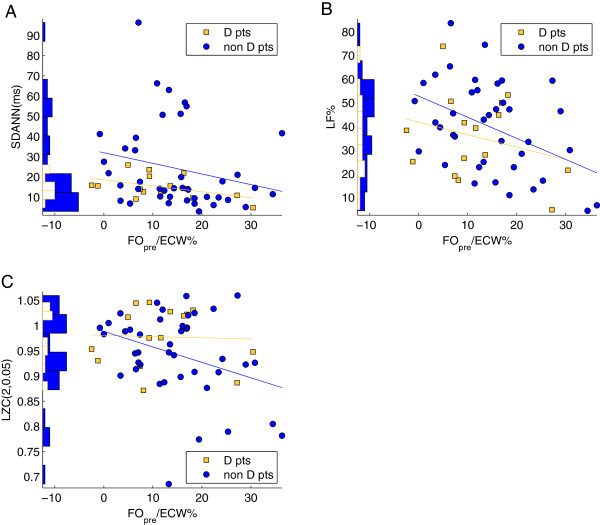
Figure 3.
Diabetes stratified results for FO/ECW% correlations with HRV indices. Diabetes stratified results for FO/ECW% correlations with SDANN, LF% and LZC (2,0.05) indices estimated during the last 30 min of HD treatment (panel A, B and C respectively). Regression lines are portrayed for diabetic patients (D pts) and non-diabetic patients (non D pts) separately. Statistically significant correlations were only obtained for non-diabetic patients and the correlation coefficients of SDANN, LF% and LZC (2,0.05) indices were r = –0.32, r = –0.43 and r = –0.34, respectively. The histograms of HRV parameter distributions are shown on the left of each panel.

