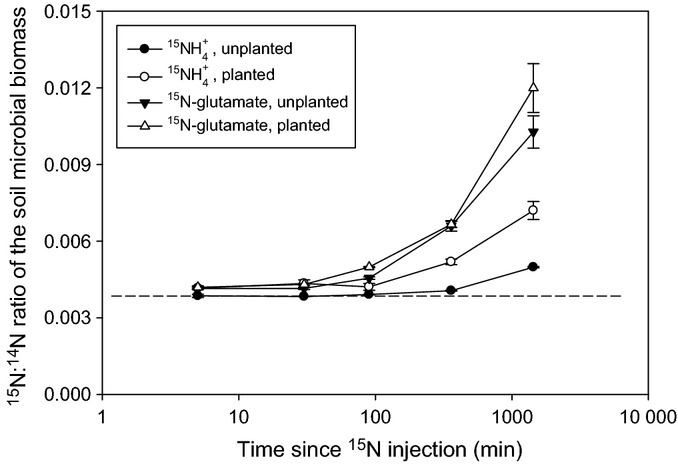
Figure 3.

15N enrichment in the soil microbial biomass after the pulse-labelled addition of  or 15N-glutamate to soil in the presence and absence of wheat (Triticum aestivum) plants. The dotted line represents 15N natural abundance in the unlabelled microcosms. Values represent mean ± SE (n = 4 replicate microcosms).
