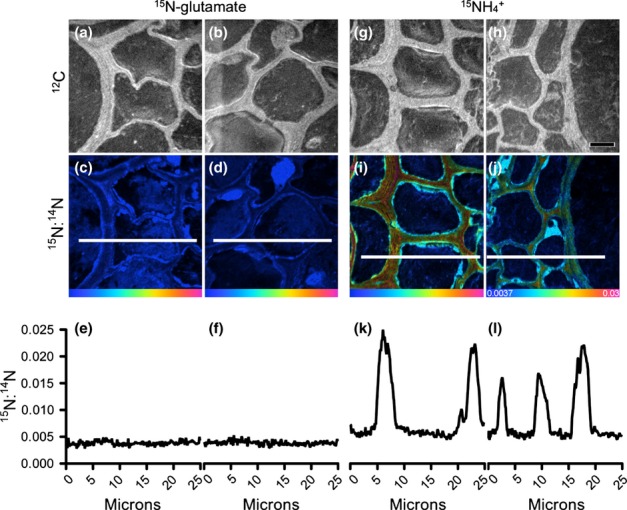
Figure 6.

Nano-scale secondary ion mass spectrometry (NanoSIMS) imaging and analysis of wheat (Triticum aestivum) roots in situ within the embedded soil core after 5 min of exposure to 15N-labelled glutamate or  . Examples of the location of cellular regions analysed within a root are depicted in Fig. 4(c). Root and cell structure is visualized in 12C images (a, b; g, h). Enrichment levels of 15N within these regions are shown as 15N : 14N Hue-Saturation-Intensity (HSI) images (c, d; i, j). The HSI colour scale (j; 0.0037–0.03; 15N : 14N natural abundance = 0.0037) applies to all HSI images. Line scans show numerical levels of 15N enrichment across the subcellular regions (e, f; k, l), with data acquired from the lines indicated on each of the respective 15N : 14N HSI images. High levels of 15N enrichment can be seen in the
  treatment within distinct cellular regions, whereas the 15N-glutamate treatment shows cells with very low levels of 15N enrichment just above natural abundance. Bar, 5 μm for all images.
