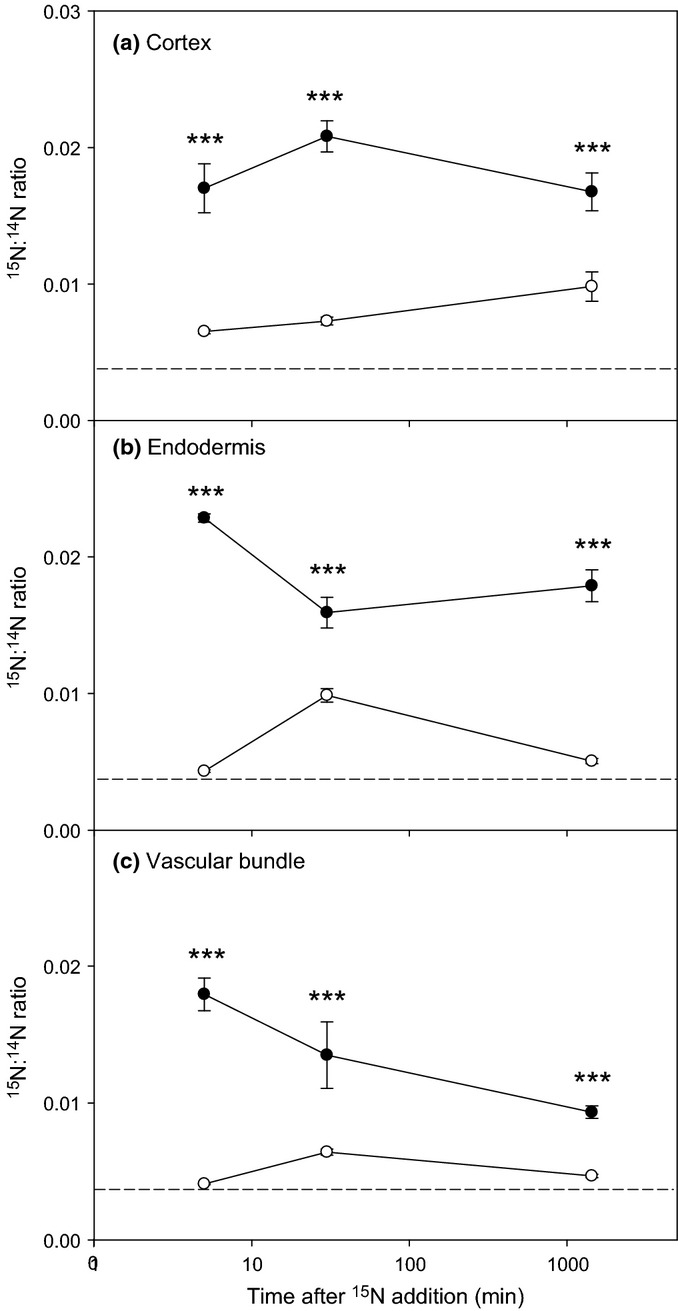
Figure 8.

Nano-scale secondary ion mass spectrometry (NanoSIMS) derived 15N : 14N isotopic ratios for different wheat (Triticum aestivum) root tissues (intercellular cortex, endodermis and vascular bundle) after injection of  (closed circle) or 15N-glutamate (open circle) into the rhizosphere. Dotted lines represent 15N natural abundance. Values represent mean ± SE (n = 13 and n = 10 for roots in the
  and glutamate treatments, respectively). The dotted line represents 15N natural abundance. Significant differences between the 15NH4 and 15N-glutamate treatments: ***, P < 0.001.
