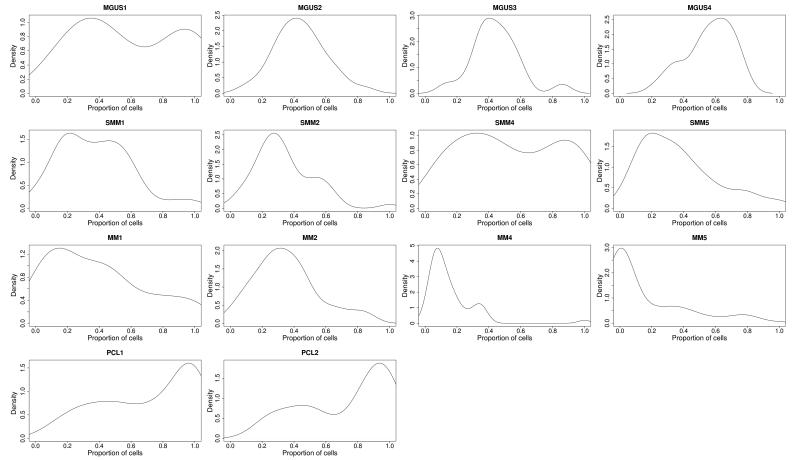
Figure 2. Clonal heterogeneity is present in all disease states.
Gaussian kernel density plots indicating the frequency of cells carrying all acquired exonic mutations. Frequency is calculated by adjusting mutant allele burden by copy number of the loci mutated. Top row, MGUS samples; Middle rows, matched HR-SMM/MM samples; Bottom row, PCL samples.

