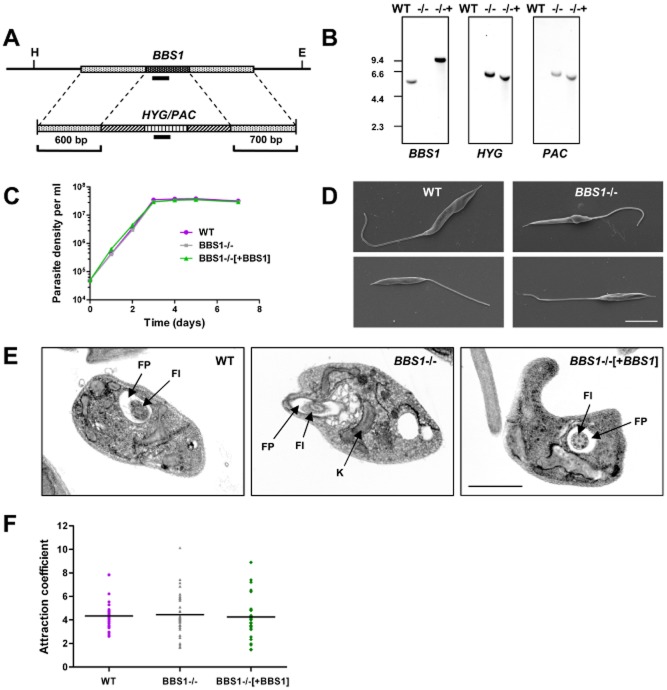
Figure 1.
BBS1 gene deletion in Leishmania major.A. Schematic diagram of the LmBBS1 locus and the plasmid constructs used for targeted deletion of the locus by replacement with hygromycin/puromycin resistance genes (HYG/PAC). Flanking sequences used to generate the targeting vectors are shown. Solid black bars represent fragments used as hybridization probes. H, HindIII site. E, EcoRV site.B. Southern blot analysis of wild-type L. major (WT), BBS1 null (−/−) and complemented (−/−+) parasite lines. Five micrograms of genomic DNA from each parasite line was digested with HindIII/EcoRV, size separated through 0.8% agarose, blotted and hybridized with DIG-labelled DNA probes (∼ 200 bp) as indicated. Corresponding DNA marker positions are shown (Kb).C. Growth of promastigotes from wild-type L. major (WT), BBS1 null (BBS1−/−) and complemented (BBS1−/−[+BBS1]) monitored over a 7-day time-course. Mean values are shown (n = 3) ± SD (error bars are not visible).D. Scanning electron micrographs of L. major wild-type and BBS1 null cell lines as above. Bar, 5 μm.E. Transmission electron micrographs of promastigotes from L. major parasite lines as above. FP, flagellar pocket. Fl, flagellum. K, kinetoplast. Bar, 2 μm.F. Procyclic promastigote osmotaxis assay. Parasite lines as above (day 3 post-inoculation) were tested for their ability to migrate into capillary tubes containing agarose and 100 mM sucrose compared with movement into control capillary tubes containing agarose alone (n = 6).Data shown are the combined results of six independent experiments.

