Figure 3.

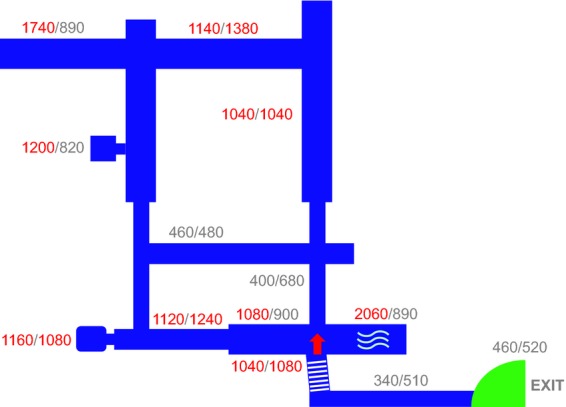
Sketch of the corridors showing the air sampling locations and the corresponding fungal spore concentrations (CFU m−3 air). Values show the average of three measurements performed each on 2% MEA and DG18 media, respectively.

Sketch of the corridors showing the air sampling locations and the corresponding fungal spore concentrations (CFU m−3 air). Values show the average of three measurements performed each on 2% MEA and DG18 media, respectively.