Figure 5.

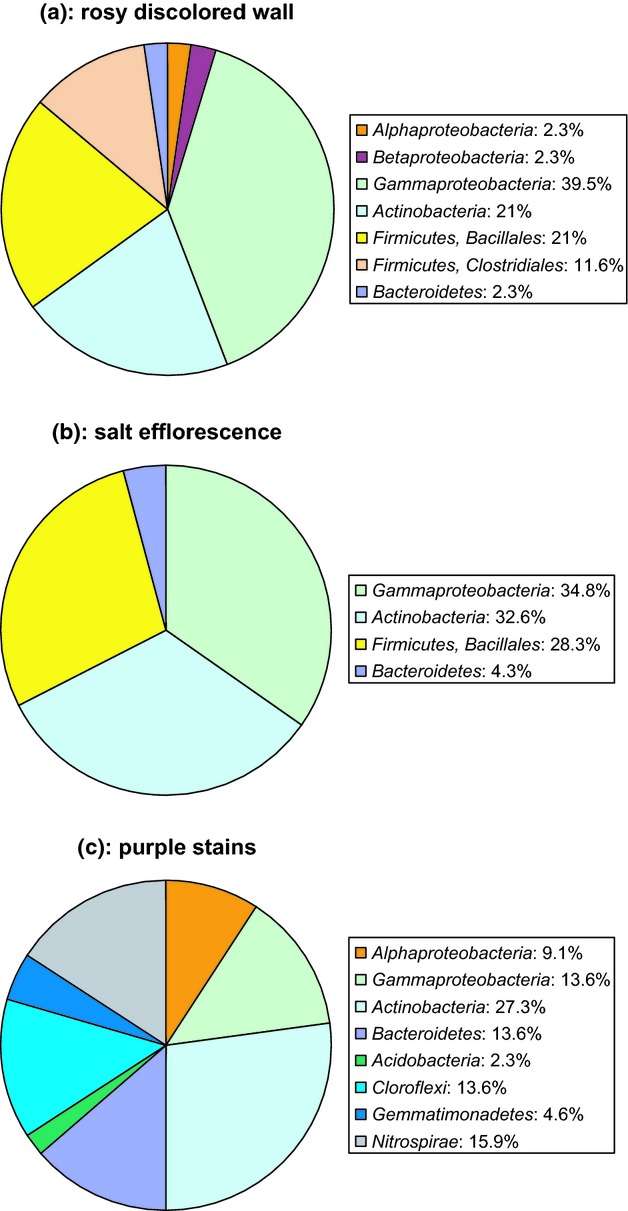
Diagram showing the relative abundance of the bacterial diversity present on wall samples. (a) rosy discolored wall. (b) salt efflorescence. (c) wall with purple stains.

Diagram showing the relative abundance of the bacterial diversity present on wall samples. (a) rosy discolored wall. (b) salt efflorescence. (c) wall with purple stains.