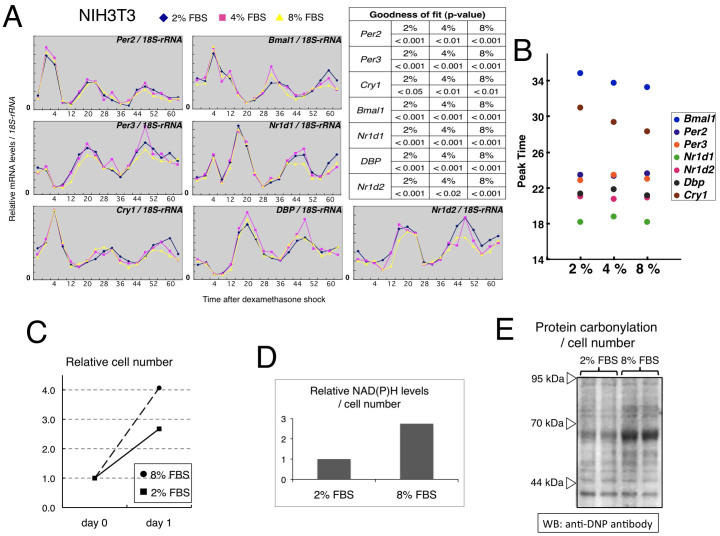
Figure 3. Metabolic activity-independent expression rhythms of clock genes.
(A) After synchronization using dexamethasone (DEX, 100 nM for 1 hr), NIH3T3 cells were cultured in the presence of 2%, 4%, or 8% serum, and chronological changes in the expression of the clock genes were compared. Expressions relative to 18S-rRNA are shown. Goodness of fit values are shown as a table on the upper right (All of them are statistically significant). (B) Comparison of second peak times calculated by cosine curve-fitting. The data show representative results from three experiments. (C, D and E) 24 hrs after exposure of NIH3T3 cells to 2% or 8% FBS-containing medium, cell proliferation, reducing power (NADH and NADPH) and reactive oxygen levels (carbonyl protein) were examined. Raw data of NAD(P)H levels were normalized to cell number. For comparison of protein carbonylation levels, loading amounts of duplicated samples were adjusted to ensure an equal number of cells per lane. The data in (C) and (D) are the average of two independent experiments.

