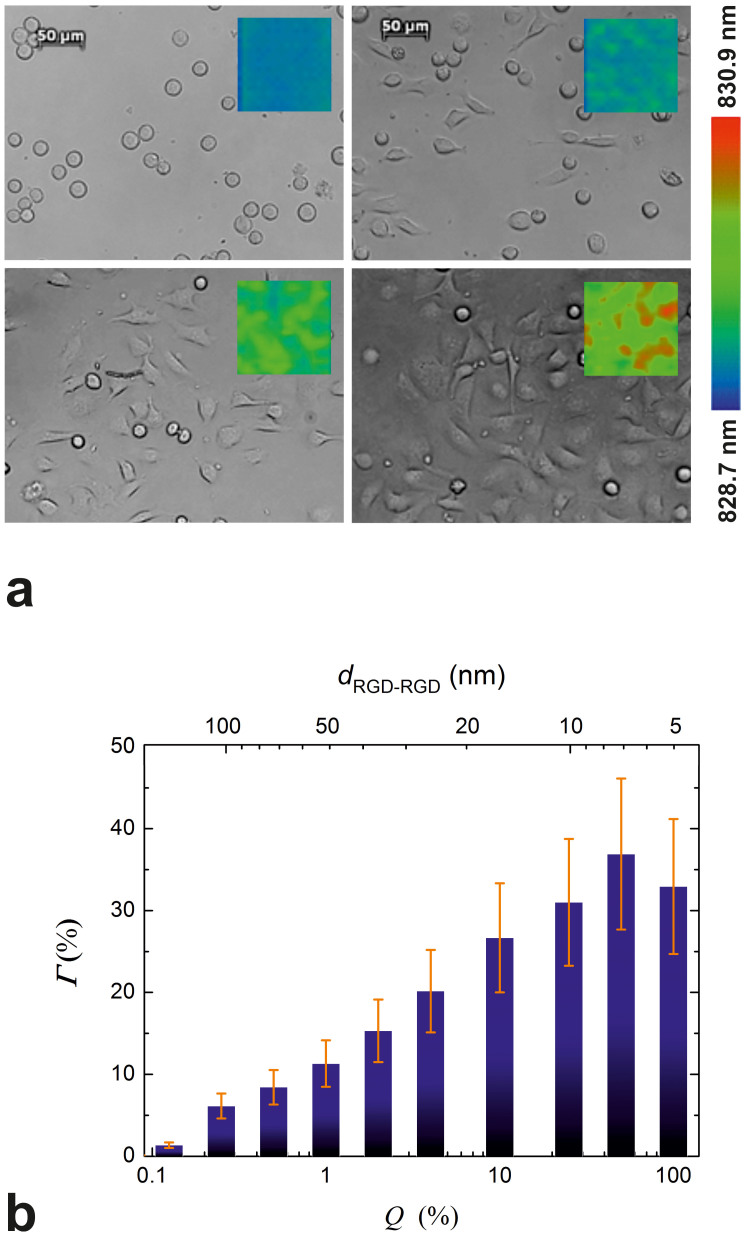
Figure 3. Microscope images taken at the end of the biosensor experiment and data obtained from image analysis.
(a) Photomicrographs of cells taken with an inverted microscope at the end of the biosensor experiments. Cells were allowed to spread on surfaces pre-coated with the mixed solutions of copolymers. Q was either 0.0, 1.0, 4.0 or 50.0% (from left to right, top to bottom). The scale bars on the top images represent 50 µm. Inset images in the photomicrographs (c.f. the color bar on the right) show the resonant wavelength distribution in the corresponding wells at the very end of the experiment. (b) The surface percent occupied by spread cells (Γ, bars) on each coating was obtained by performing image analysis on the photomicrographs taken at the end of the biosensor experiment. Data are presented as a function of the volume percent of a 1 mg/ml PLL-g-PEG-RGD solution in the mixed solution of copolymers (Q, bottom axes in the graphs), and the average interligand distances (dRGD-RGD, top axes in the graphs). Error bars represent estimated errors, see text for details.

