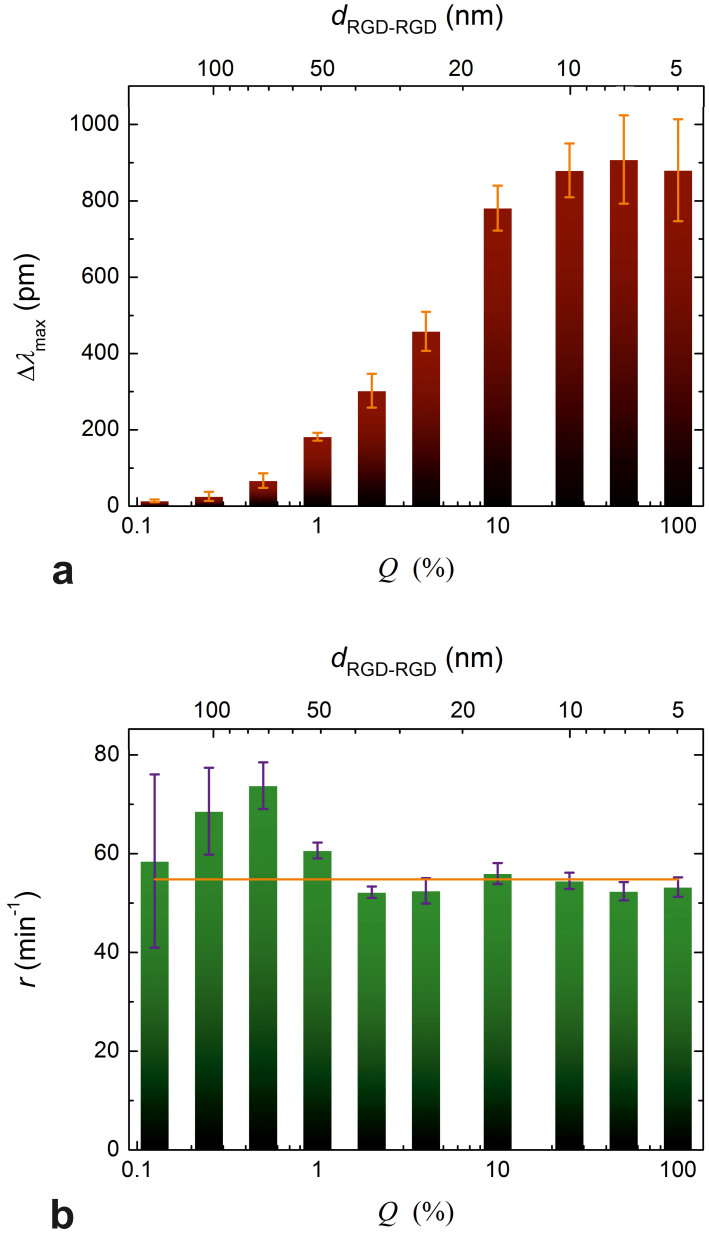
Figure 4. Maximum biosensor responses and the rate constants of spreading.
(a) Maximum biosensor response (Δλmax) as a function of Q (bottom axis) and the dRGD-RGD average interligand distance (top axis). The values were obtained by fitting Eq. 5 to the individual spreading curves and averaging the parameters obtained from triplicate fits. Error bars represent the standard deviation from the mean Δλmax values (practically the same as the half-widths of the ‘clouds' drawn around the end-points of the curves in Fig. 2a). (b) The rate constant (r) as a function of Q (bottom axis) and the dRGD-RGD average interligand distance (bars). Values and error bars were obtained the same way as for Δλmax. The solid horizontal line represents the average value of all rate constants.

