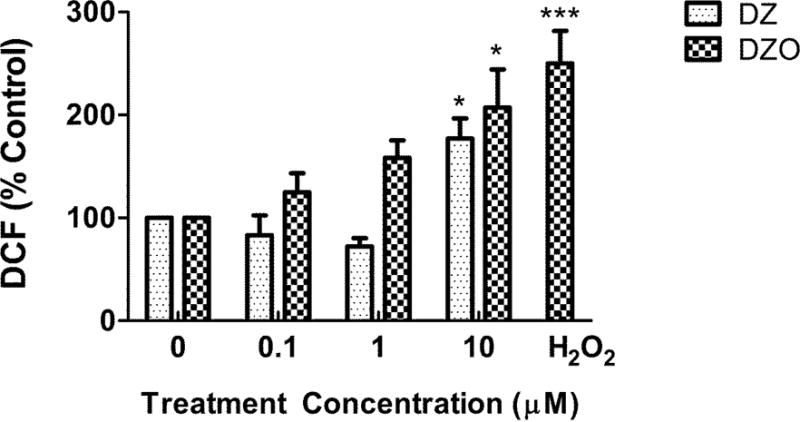
Figure 4. DZ and DZO increase oxidative stress in astrocytes.

Intracellular ROS production in DZ- and DZO-treated astrocytes over 1 h period. Concentration of the positive control H2O2 was 20 μM. Results are expressed as percent of untreated astrocytes, and bars represent the mean (± SEM) of three separate experiments done in duplicate. Significantly different from the respective untreated controls, *p<0.05, ***p<0.001.
